
Heads-Up Display for Dollar-Cost Averaging
Know when market risk is rising.
A daily check on the economy, stocks and digital assets, built to flag trouble early.
HUD DCA is a daily risk report for new and seasoned investors. Every day it checks the market warning signs and alerts you to how they are trending and what is coming up next. Like the heads-up display in a cockpit, it puts the critical readings in your line of sight so that you can stay alert to what is ahead.
12 risk indicators
The economy, stocks and digital assets, in one place.
Built to warn early
Caution levels sit ahead of each alert line.
Macro Calendar
Fed meetings, inflation, jobs and growth data on a two-week calendar, explained plainly.
Stocks and Crypto
S&P 500, Nasdaq, Dow, Bitcoin and Ethereum every morning, plus Bitcoin ETF flows, Fear & Greed, and Bitcoin vs its 200-day average.
Easy to understand
Every reading explained: what it is, why it matters, how to read it. No finance background needed.
Who it is for
For new and seasoned investors
New to investing? Every signal is explained in plain terms, so you learn what actually moves markets. Been at it for years? You get the full dashboard: 12 readings against their lines, a daily 'what changed' briefing that flags any large moves, the macro calendar, stocks and crypto side by side, Bitcoin ETF flows, and every term defined where you read it.
Why we built it
We got blindsided in 2022
The warning signs were public: credit markets, the jobs data, the bond market, the dollar. But they were scattered across a dozen sites and buried under the headlines, and we did not see the full picture until it had already become the news. So we kept investing straight into a major market drawdown that lasted the better part of a year:
| Market | High | Low | Drawdown |
|---|---|---|---|
| S&P 500 | 4,796.56 (Jan 3, 2022) | 3,577.03 (Oct 12, 2022) | -25.4% |
| Nasdaq Composite | 16,057.00 (Nov 19, 2021) | 10,213.29 (Dec 28, 2022) | -36.4% |
| Bitcoin | $67,567 (Nov 8, 2021) | $15,787 (Nov 21, 2022) | -76.6% |
Closing-price basis. Sources: S&P Dow Jones Indices · Nasdaq Composite · Bitcoin
We had no way to know when to pause. If we'd had this heads-up display back then, we would have seen the early warnings stacking up and paused our buying until the readings cleared.
So we built the engine that we wished we had in 2022. Now, we're opening it up to everyone else.
How it works
Three steps, every day
1
We collect
Public data from the Federal Reserve, the U.S. Treasury, ISM and market-data providers. Every figure traces to a publisher you can check.
2
We check
Each of the 12 readings against its own caution and alert lines, closest to trouble first.
3
You read
What is clear, what is close, what moved, and the next release on the calendar. No buy or sell calls.
Inside every daily report
Take a look inside
Six parts, one short read. The screens below are from a recent daily report.
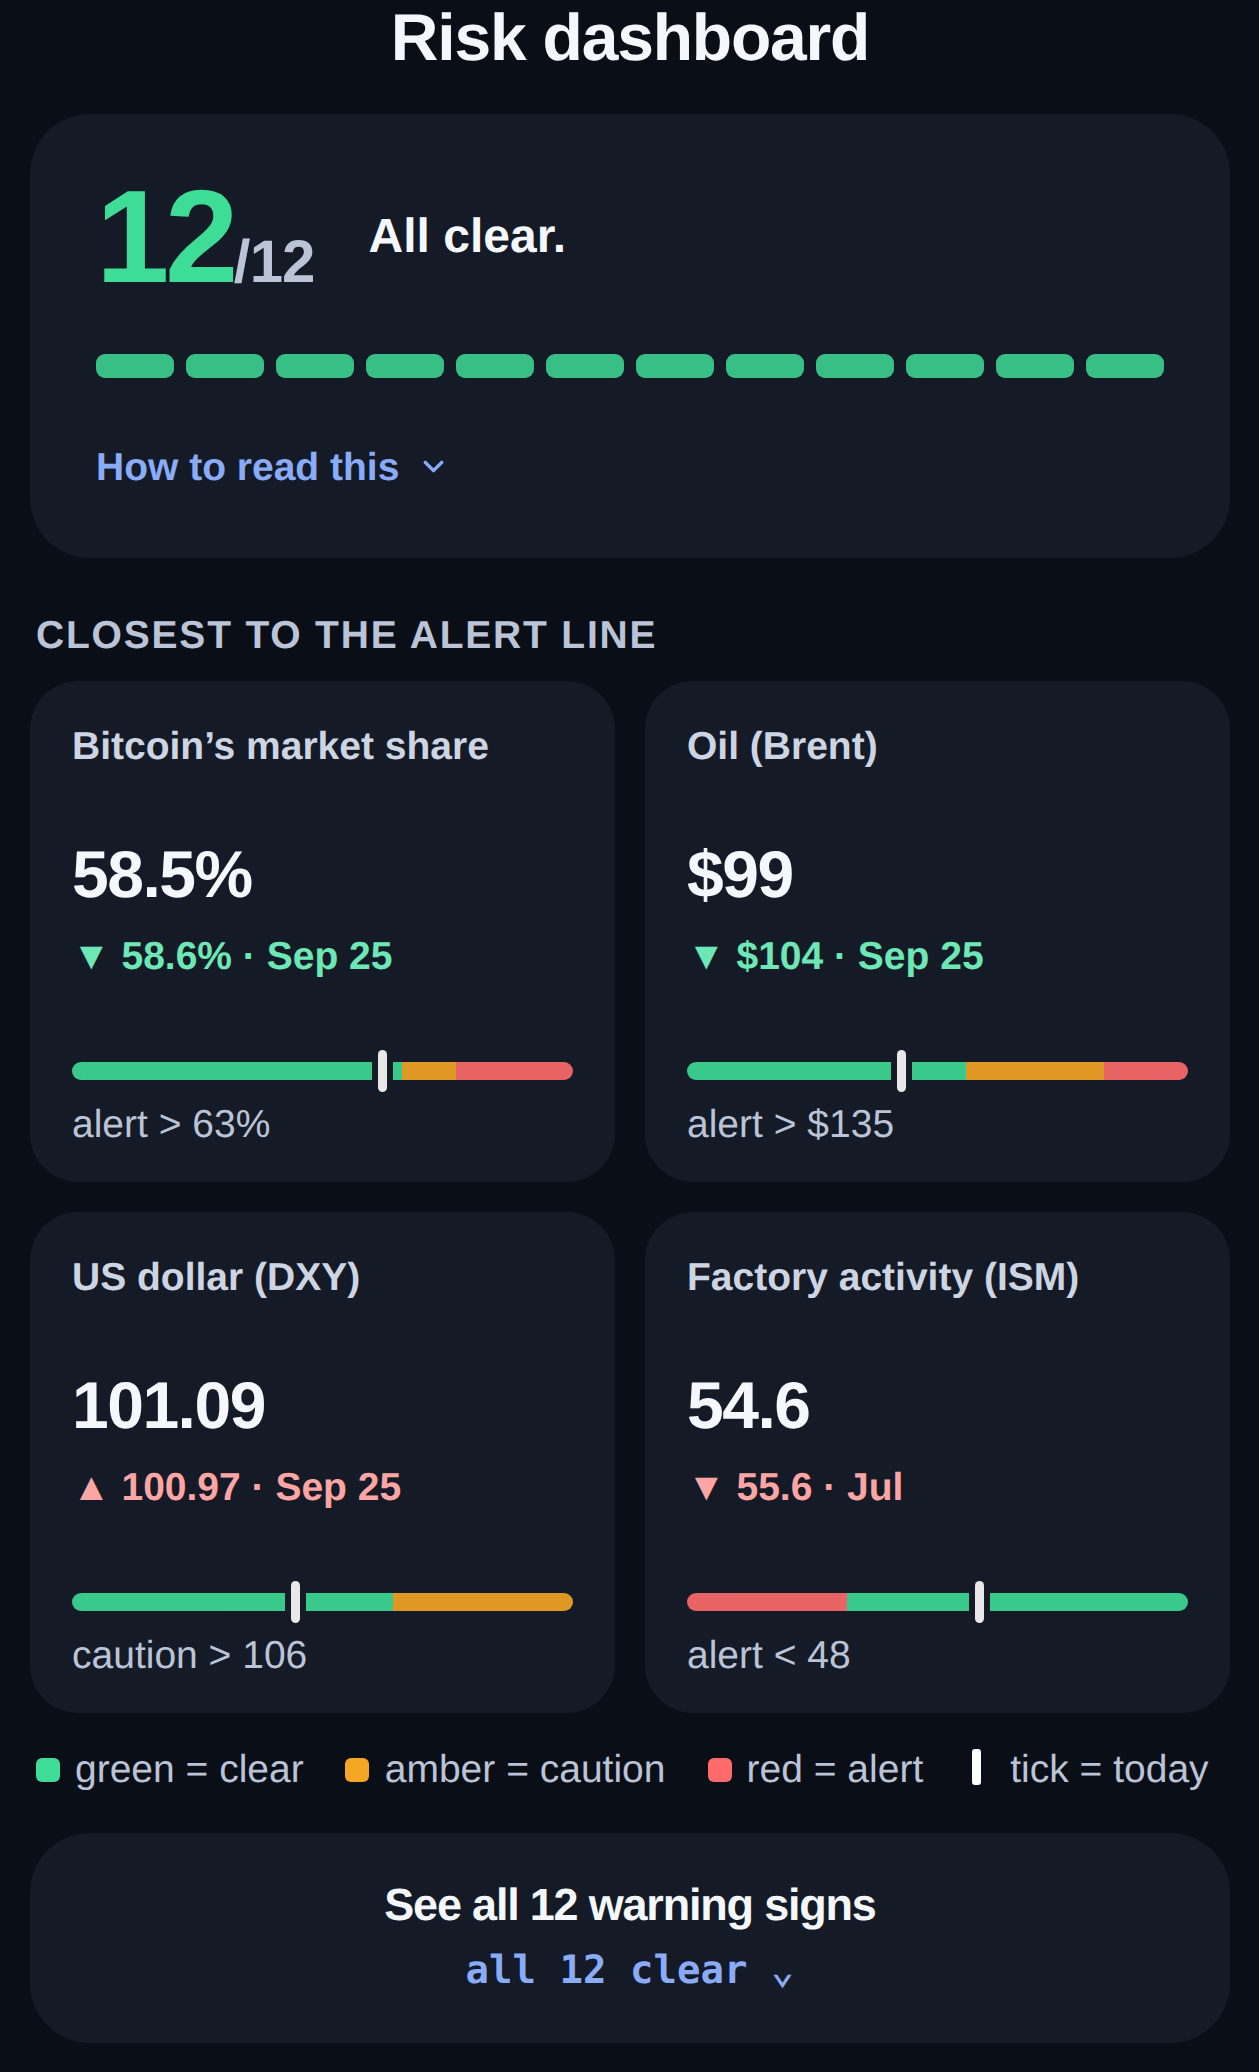
1 · Risk dashboard
All 12 warning signs, every day
Each reading sits against its own caution and alert line. The closest to trouble come first, and a short summary says what moved and why it matters.
Economy & markets (8): recession warning, credit spreads, unemployment trend, factory and services surveys, the dollar, oil, stock-market fear
Crypto (4): ETF fund flows, Bitcoin vs its 200-day average, stablecoin cash, Bitcoin's market share
2 · Coming up
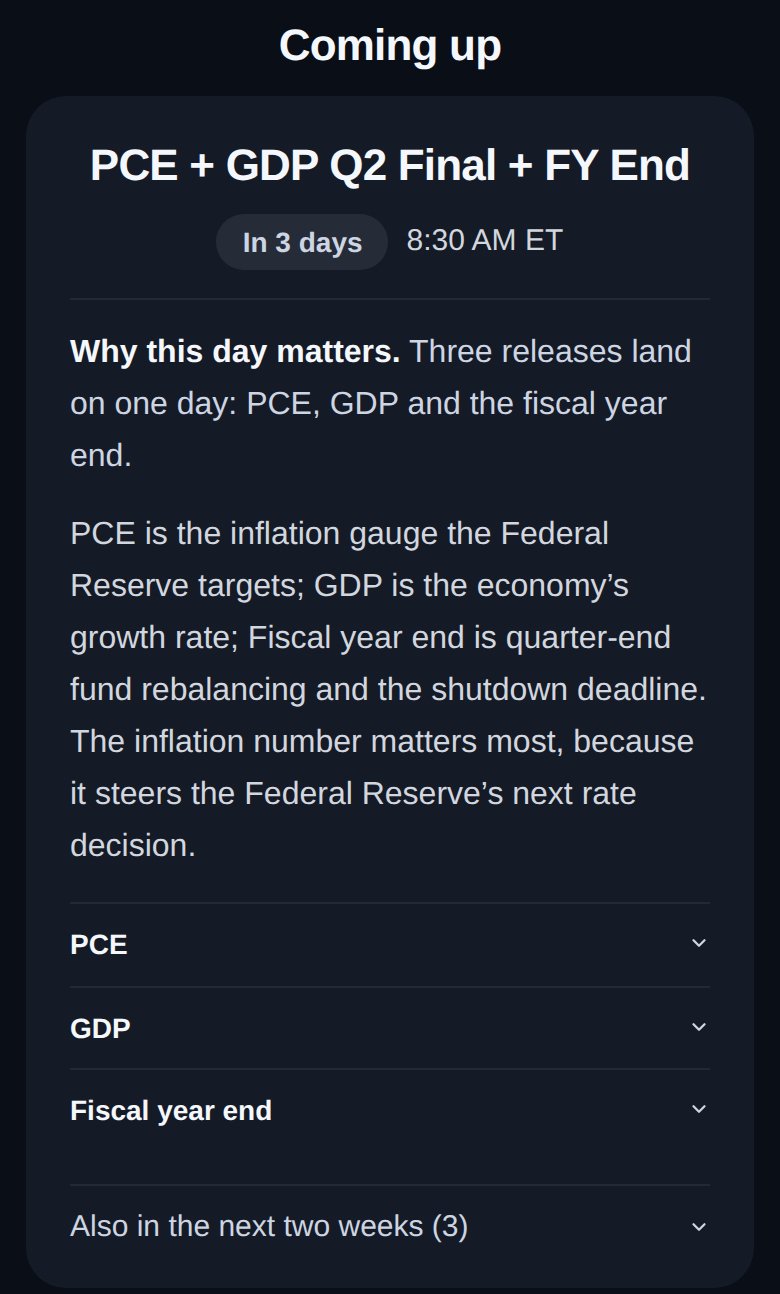
What's next, explained
Fed meetings, inflation, jobs and growth data move markets. Every report lists what's next, with a tap-to-open explainer.
What the release is
Why it matters for your money
How to read the number when it lands
Everything else in the next two weeks
3 · Stocks
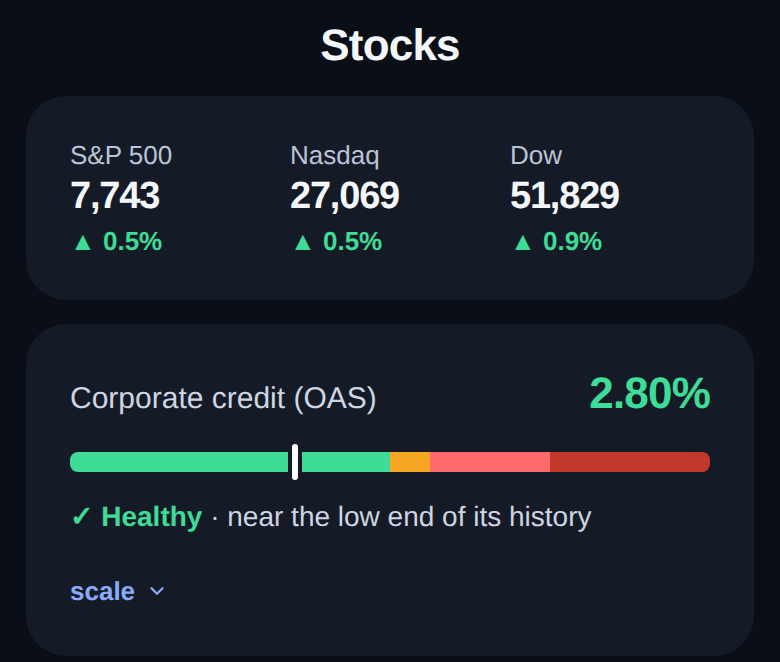
The big three indexes, side by side
The S&P 500, Nasdaq Composite and Dow with their day change, plus the corporate credit snapshot.
Price and day change for each index
Corporate credit (OAS) with its full scale
4 · Crypto
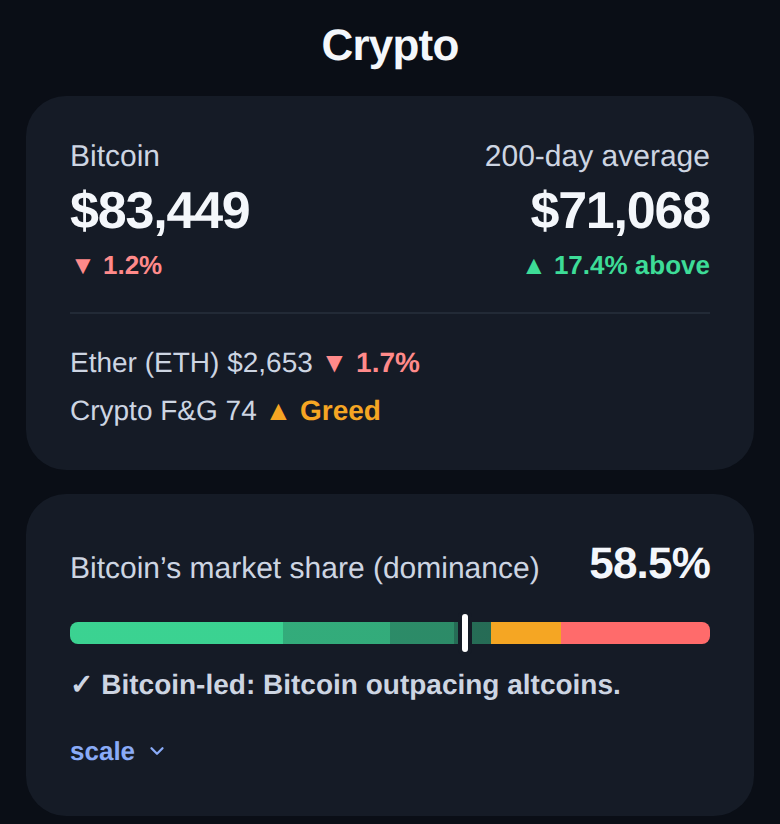
Bitcoin and Ethereum, in context
Bitcoin's price against its 200-day average, Ethereum, the Fear & Greed index and Bitcoin's market share, each with a clear reading.
Price, trend and mood in one place
Every color range labeled with its number
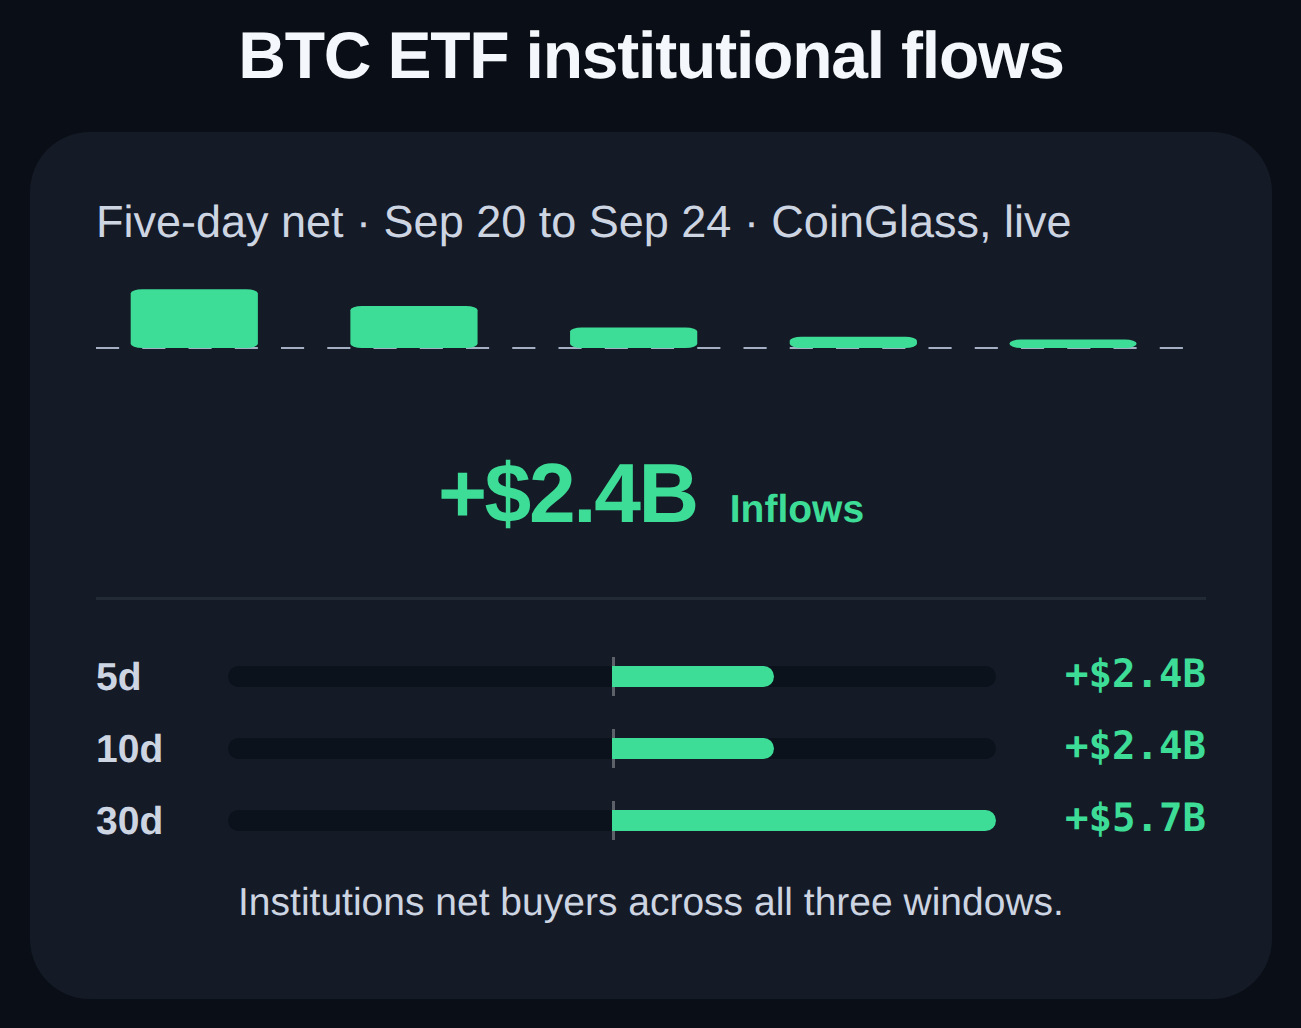
5 · Bitcoin ETF flows
What the big money did
Whether funds and institutions moved money into or out of U.S. spot Bitcoin ETFs over 5, 10 and 30 days.
Daily flow bars
5, 10 and 30-day totals
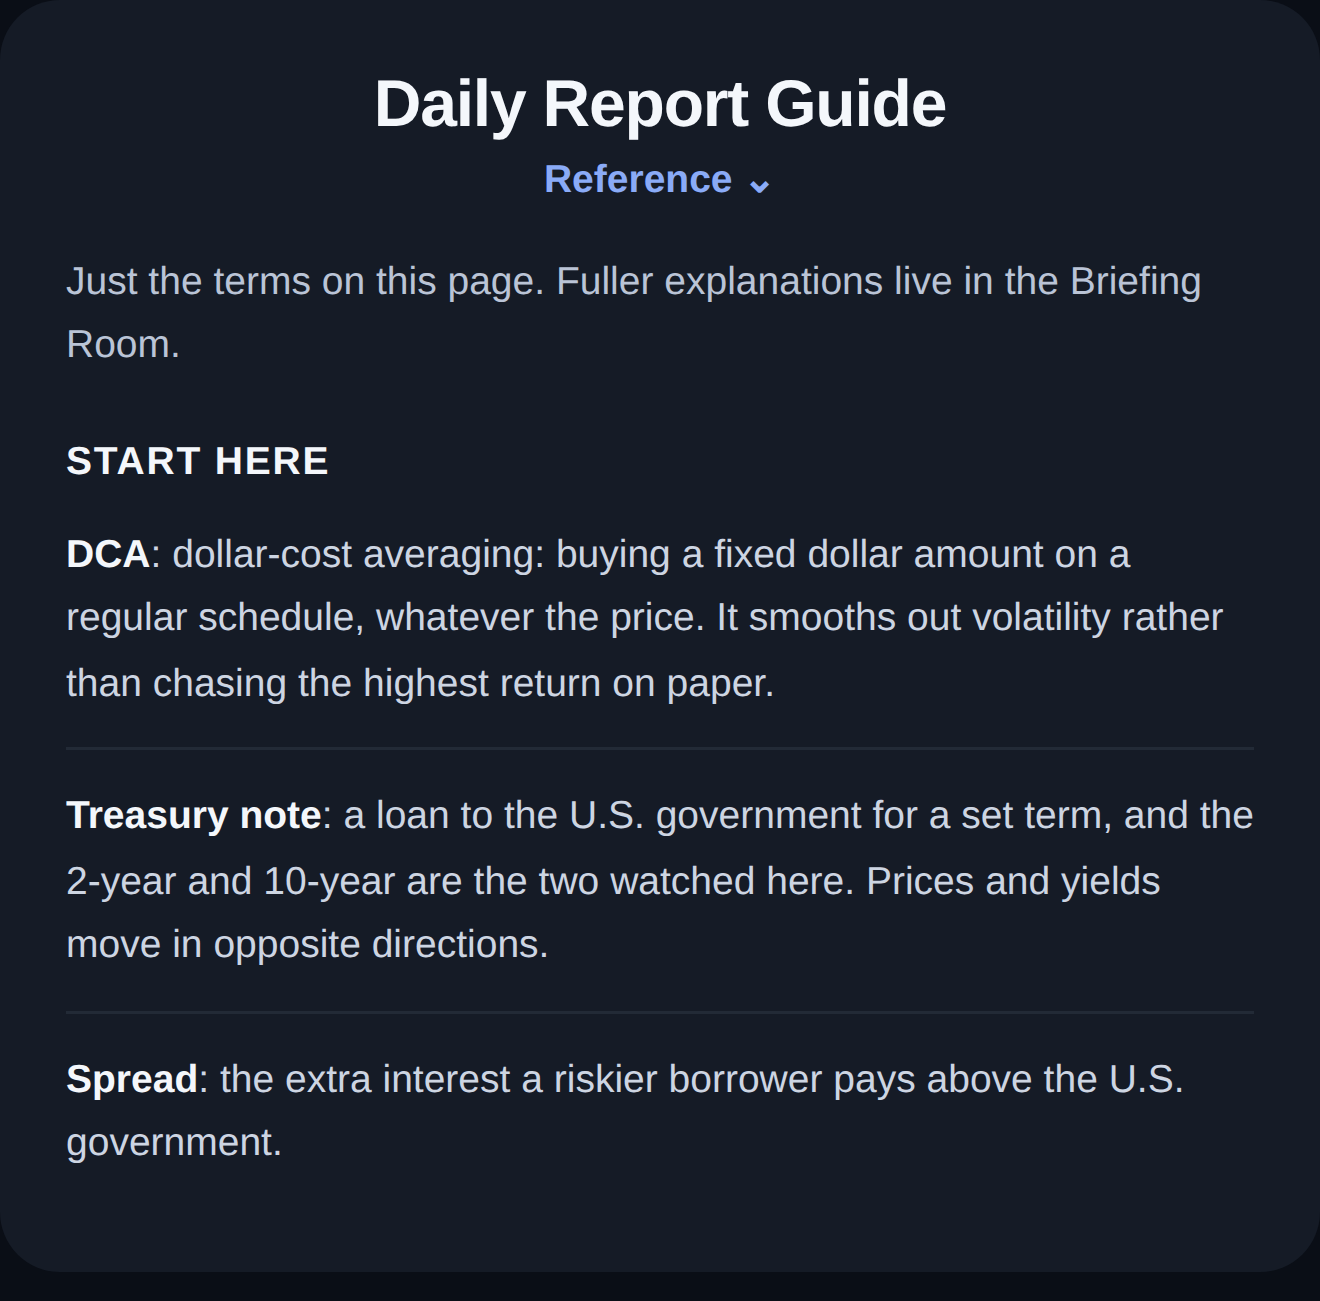
6 · Built-in guide
A glossary inside every report
Every term defined right where you read it.
Built on published research
Why we track these readings
The yield curve as a predictor of U.S. recessions ↗Estrella & Mishkin, Federal Reserve Bank of New York, 1996
Credit spreads and business cycle fluctuations ↗Gilchrist & Zakrajsek, American Economic Review, 2012
The Sahm rule for recessions ↗Claudia Sahm, Brookings Hamilton Project, 2019
Oil and the macroeconomy since World War II ↗James Hamilton, Journal of Political Economy, 1983
Full Research: Briefing Room →
Pricing
Less than $1 a day
Monthly
$29/mo
Billed monthly
Save 43%
Annual
$16.58/mo
Billed at $199/yr
The full daily report, every day
All 12 indicators with caution and alert lines
Catalyst explainers and the two-week calendar
Stocks, crypto snapshots and ETF flows
The full archive of past reports
Cancel anytime · 30-day money-back guarantee
FAQ
Frequently Asked Questions
Every number is public. Why not build this myself?›
You could, and we link every source so you can check us. What you pay for is the daily work: pulling 8 sources, catching bad or stale data, checking each reading against its line, and writing up what changed and what is next, every single day, before your coffee is done.
How is this different from other market tools?›
Most market tools either push you toward buying or bury you in charts. HUD DCA does one job: a daily check on whether risk is building in the economy, stocks and digital assets, with every indicator shown against its own line. It never tells you what to buy or sell.
I only invest in stocks. Is this for me?›
Yes. 8 of the 12 indicators are economy and stock market data: the recession warning, unemployment trend, the factory and services surveys, the US dollar, corporate credit, stock-market fear and oil. The digital asset rows are for people who hold crypto, and for anyone thinking about buying in: they show whether conditions look calm or risky before you decide. Skip them if neither applies to you.
Is this financial advice?›
No. HUD DCA provides market information for educational purposes only. We are not registered investment advisors. You make your own decisions; the report gives you the data to make them with.
Can I cancel anytime?›
Yes. 7-day free trial, cancel anytime, and a 30-day money-back guarantee on paid plans. No questions asked.
Not ready for the full report?
Get the free Saturday Briefing
A monthly market recap, the catalysts on deck and one easy-to-follow chapter. The last Saturday of every month.
No card · No spam · Unsubscribe in one click · See what is in it →
This is NOT financial advice. HUD DCA™ provides market information for informational and educational purposes only. HUD DCA™ LLC is not a registered investment advisor, broker-dealer, or commodity trading advisor. Digital assets are highly volatile and involve substantial risk of total loss. Past performance is not indicative of future results. Consult a qualified financial advisor before making investment decisions.