The Problem
The news contradicts itself daily. One headline says buy the dip. The next says the crash is just starting. You're stuck guessing and relying on the opinions of others — and guessing costs money.
Don't get blindsided by the next major market move. Stop guessing at market tops. Stop panic selling at the bottom.
Most investors already use dollar-cost averaging. But there are still 3 very important questions left unanswered:
- When should you invest?
- How much this week?
- When should you sit on cash — or reduce your holdings?
Our engine helps you answer those three questions every morning, so your DCA now becomes Dynamic Dollar-Cost Averaging — for less than $1 a day.
The Solution
Every day, the engine aggregates and analyzes 19 economic and crypto indicators — pulling 25+ data points across 8 sources — then distills all of it into one score and one condition, telling you whether to invest, wait for data, or step back.
13 indicators drive the daily score. 6 more act as override triggers and risk monitors that can change the signal independently.
That’s what makes it Dynamic Dollar-Cost Averaging.
Every day, the engine tells our paid subscribers:
- What today’s conditions are and why
- What DCA investors historically do in these conditions
- What’s coming this week that could change everything
- Exactly which indicators are driving the signal — every point shown, nothing hidden
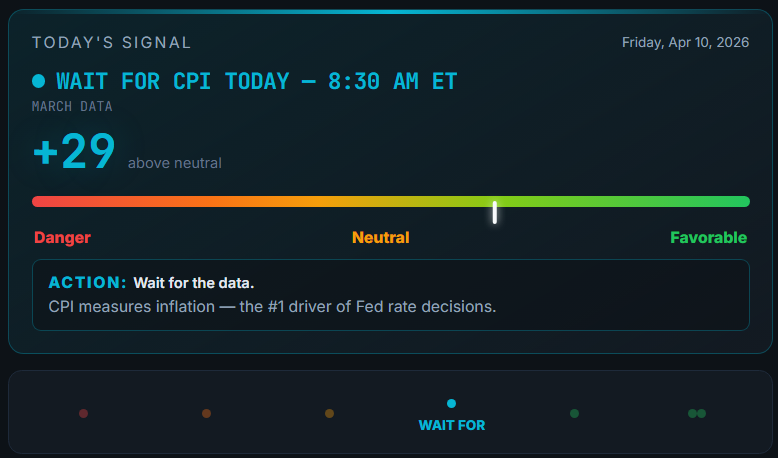
EXAMPLE — WHAT SUBSCRIBERS SEE EVERY DAY
The Six Conditions
FAVORABLE
Conditions are better than normal.
WAIT FOR
Conditions are positive but a major report drops soon.
NEUTRAL
Nothing stands out either way.
CAUTIOUS
Conditions are deteriorating.
DANGER
Multiple warning signs firing.
Backtested Across 8 Years of Market Data
Engineered across over 3,100+ days of market data (2017 to 2025). The engine caught 21 of 24 major events where macro data provided advance signals.
DANGER
2018
Bitcoin crash (–84%). Flashed DANGER during the January freefall.
VERY FAV
Mar 2020
COVID crash. Strongest buy signal while everything crashed.
NEUTRAL
Nov 2022
FTX collapse. Didn’t panic, held steady at the bottom.
CAUTIOUS
Oct 2025
Bitcoin ATH at $126K. Flagged the cycle top.
Subscribers Get
Daily condition + score✓
Action line✓
Dual Fear - Buy Alerts — consider doubling your DCA✓
WAIT FOR alerts — pause your DCA before major macro events✓
75+ macro event calendar✓
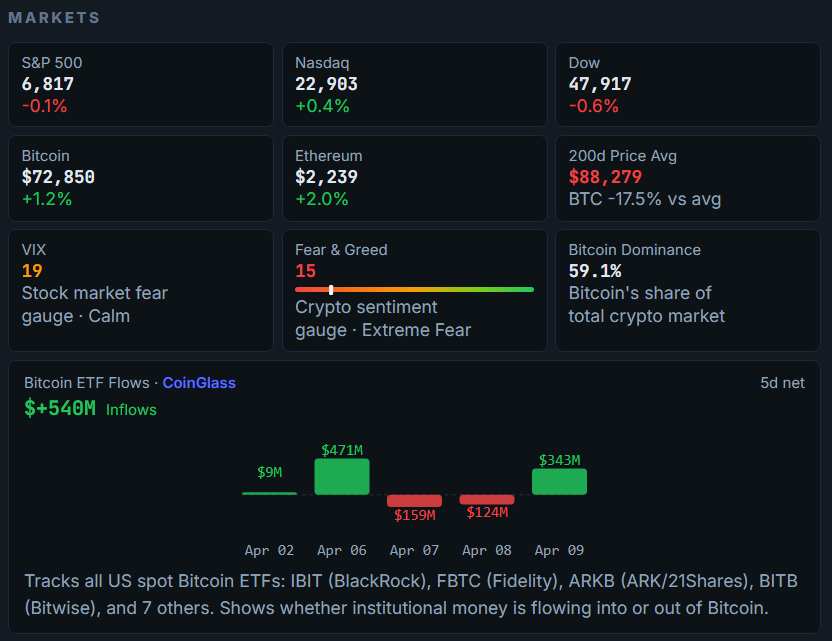
BTC insights (ETF flows, 200-day SMA, dominance, MVRV)✓
Noise-Filter analysis (Positive, Risks, Upcoming)✓
Markets (S&P 500, Nasdaq, Dow, Bitcoin, Ethereum)✓
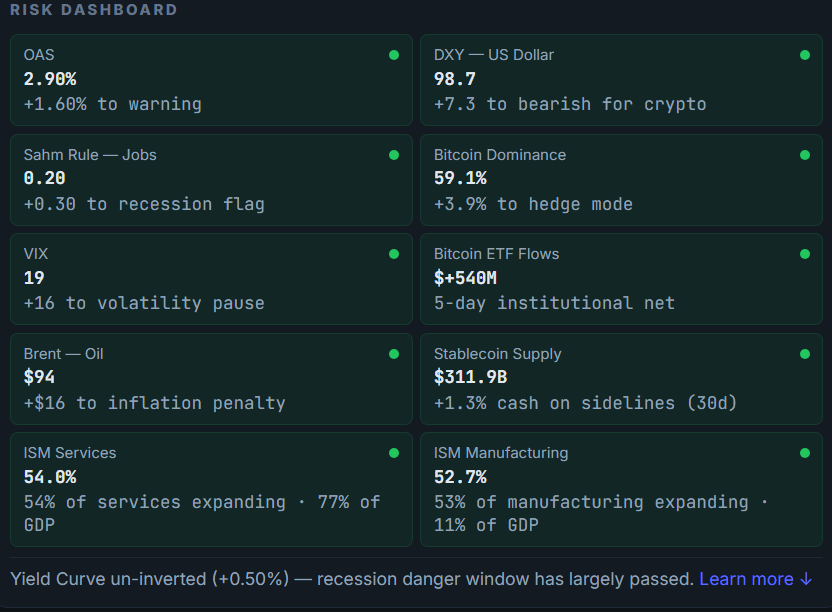
Risk monitor dashboard (credit, jobs, oil, dollar, VIX, M2, etc.)✓
Full score breakdown✓
Bottom Line takeaway✓
$16.58/mo
Billed annually at $199. Save 43% — two months free.
A single poorly timed trade can cost hundreds. Our service costs less than $1 a day.
Or $29/mo monthly. One price. No upsells.
Subscribe — $16.58/mo →30-day money-back guarantee. No questions asked.
This is NOT financial advice. HUD DCA™ provides market condition assessments for informational and educational purposes only. HUD DCA™ LLC is not a registered investment adviser, broker-dealer, or commodity trading advisor. All historical results are hypothetical, backtested with the benefit of hindsight, and do not represent actual trading. Model parameters were optimized using historical data. Out-of-sample validation (2017–2019) was performed on data not used during calibration. Digital assets are highly volatile and involve substantial risk of total loss. Past performance is not indicative of future results. Consult a qualified financial advisor before making investment decisions.