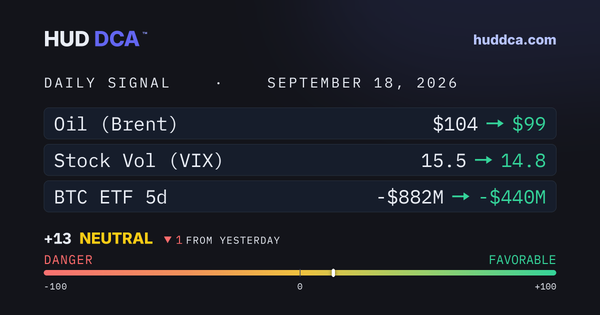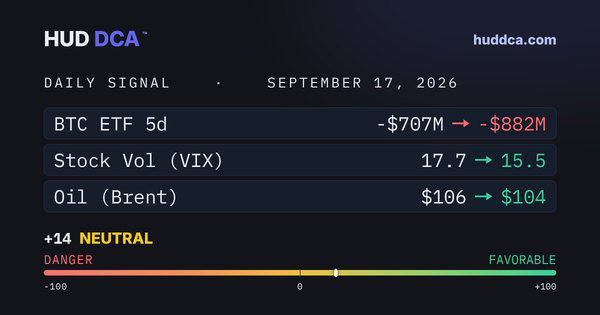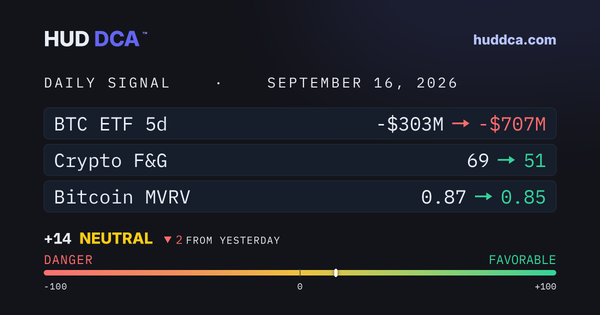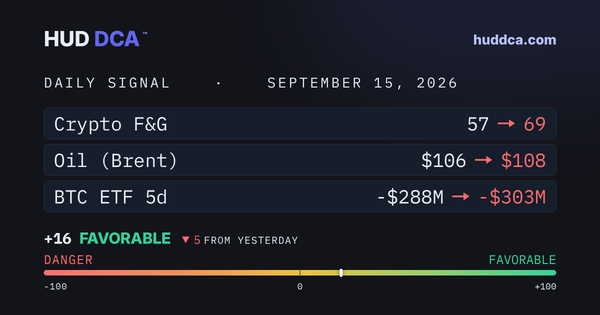
Daily Signal July 7: June's factory and services PMIs are in

This week's clearest signal came from the economy, not the charts: June's factory and services PMIs held in growth. Steady growth with easing inflation is what stocks and crypto want to see, so next week's inflation reports are the real test, with the signal balanced until then.

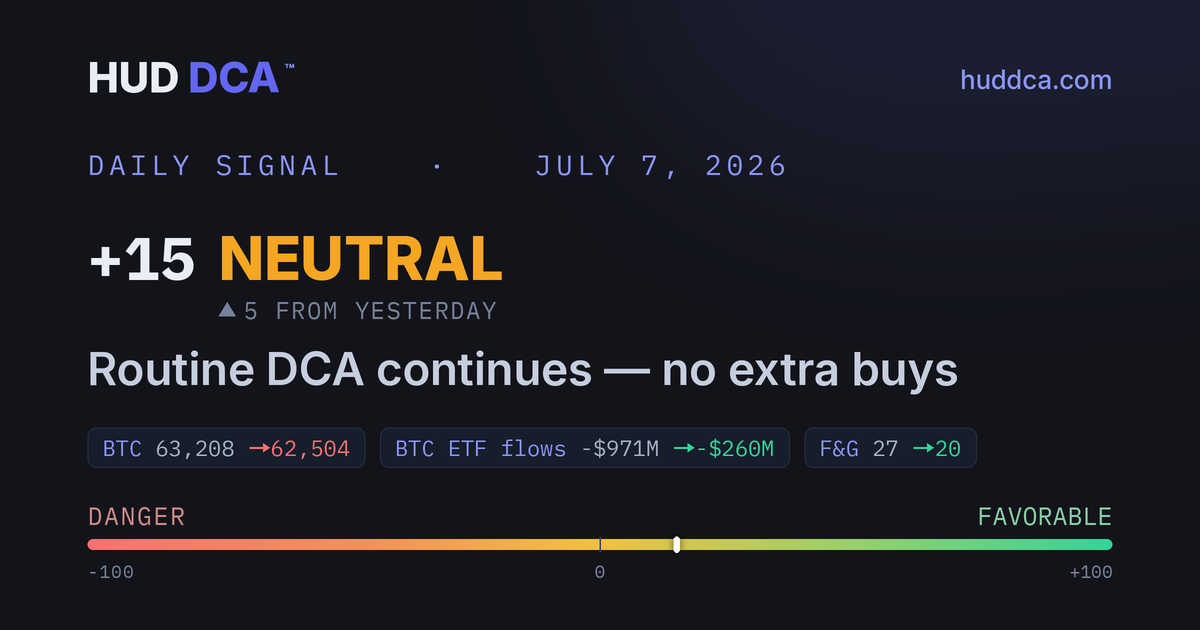
Daily Signal July 7: June's factory and services PMIs are in

How this score works
Today’s Signal · Jul 7
+15
▲ +5 from yesterday
Flags eased, not fresh demand
NEUTRAL
−1000+100
Routine DCA continues — no extra buys
Signals are balanced — no strong edge either way. Routine DCA continues; no reason to change.
What moved today
BTC63,20862,504BTC ETF flows−$971M−$260MF&G2720
Next catalystIn 7 days
Tuesday, July 14
CPI (June) — the Consumer Price Index, the headline inflation reading; can move stocks and crypto.

Today’s analysis

The score has firmed to the top of its recent range, right at the line between Neutral and Favorable, and the driver is subtraction rather than demand: the exit from the spot Bitcoin funds is easing while the value backdrop only deepened
The composite has climbed to its strongest zone in roughly five weeks, pressing right against the boundary between Neutral and Favorable. The honest driver is deceleration, not fresh buying: the pace of spot Bitcoin ETF selling cooled sharply this week, while the accumulation backdrop firmed. Crypto fear slid deeper toward its extreme, on-chain valuation sat a notch further into discount, and corporate credit stayed unusually calm. For a scheduled buyer, the pressure is lifting at the margin and the markdown is still on offer, wherever the badge settles from one reading to the next.
This is a boundary reading, not a breakout: Bitcoin is riding right on its long-term trend line and crossing it through the day, so the badge itself can flip between Neutral and Favorable while nothing underneath changes
Keep the move in proportion. The score sits on the line between Neutral and Favorable, and it got there because Bitcoin is hovering right at its long-term trend line, ducking just below and popping just above it from one reading to the next. The score, not the label, is the signal: at the boundary the badge can read either way on a small price wiggle. The structural drags have not cleared. Bitcoin still trades below its long-term average, the spot funds are still in a net-outflow run measured in weeks, and dollar-pegged sideline cash keeps shrinking. The right posture is a measured step, not a lunge.
The near-term hurdles just cleared cleanly: the June factory and services surveys landed in expansion with prices cooling; the real test is back-to-back inflation prints the week of the fourteenth
The calendar’s near-term checks came and went constructively. The June factory and services surveys both printed in expansion, cooling a touch from May but holding growth, and the price components inside them eased, a soft-inflation signal that sits well with the value backdrop. From here the docket thins, then concentrates. The week of the fourteenth stacks the two inflation reports, consumer and wholesale, on consecutive days, the pair that most directly moves rate expectations and, through them, growth stocks and crypto together. The crypto market-structure bill stays on watch with no floor date.
Read the full breakdown
The score has firmed to the top of its recent range, right at the line between Neutral and Favorable, and the driver is subtraction rather than demand: the exit from the spot Bitcoin funds is easing while the value backdrop only deepened
  1. Here is the anatomy, told through the flows. The five-day net for the US spot Bitcoin ETFs (the funds that hold Bitcoin on investors’ behalf) improved from a heavy outflow to a light one, but the reason matters: the measurement window rolled forward across the holiday and shed late June’s worst selling days, so this is decelerating pressure and window mechanics, not a wave of fresh inflows. The longer seven-day tally is still net negative. We say so plainly, because the point of this report is a signal you can check rather than one you take on faith. What genuinely strengthened is the value case. The on-chain valuation gauge (MVRV, price against what holders paid) sat a shade further into discount even as the score firmed, corporate credit spreads (the extra yield lenders demand from companies, a stress gauge) stayed near their calmest of the cycle, and crypto sentiment slid deeper into fear, the backdrop patient buyers prefer. For a dollar-cost buyer the readout is simple: conditions improved a real notch, the exit is slowing rather than reversing, and the discount has not gone anywhere.
This is a boundary reading, not a breakout: Bitcoin is riding right on its long-term trend line and crossing it through the day, so the badge itself can flip between Neutral and Favorable while nothing underneath changes
  1. Threshold readings deserve threshold confidence. The composite is a continuous score and the labels are lines drawn across it; right now Bitcoin is hovering within a whisker of the long-term trend line that governs one of the larger inputs, and it has been slipping just below and reclaiming just above that line intraday. Each crossing flips a sizeable penalty on or off, which is enough to swing the badge between Neutral and Favorable without the underlying picture changing at all, so treat this as the top of Neutral brushing Favorable rather than a new regime. The positioning backdrop keeps the caution honest. The US spot Bitcoin ETFs (funds that hold Bitcoin for investors) are still running net outflows on a multi-week view, and this week’s lighter figure is a slower leak, not a turn to inflows. Stablecoin supply (dollar-pegged tokens that sit as ready buying power) has kept shrinking, so the sideline cash that would fund a durable push is thinning rather than growing. And Bitcoin remains below its long-term average, the condition that historically pairs with weaker altcoin performance. None of that cancels the improvement; it argues for sizing the step to the conviction. If the upgrade holds, it will survive next week’s inflation data.
The near-term hurdles just cleared cleanly: the June factory and services surveys landed in expansion with prices cooling; the real test is back-to-back inflation prints the week of the fourteenth
  1. The near-term macro checks resolved in the market’s favor. The June ISM manufacturing survey (a monthly gauge of factory activity) landed at the start of the month and services followed on Monday after the holiday; both stayed in expansion while easing modestly from May, and, more usefully for risk assets, the price sub-indexes inside each cooled, with services prices at a multi-month low, a gradual easing of the inflation and supply-chain pressure that has been the market’s overhang. Services hiring also swung back to growth. From here the docket goes quiet, then dense. The heavyweight round arrives the week of the fourteenth: the Consumer Price Index (CPI, the headline inflation reading) and the Producer Price Index (PPI, wholesale prices that feed it) land on consecutive days, the pairing that most directly sets interest-rate expectations and, with them, the tone for July across every risk asset. In the background, the CLARITY Act (a US crypto market-structure bill) stays on the watchlist with no floor vote scheduled; the tell remains whether Senate leadership files for a vote before the August recess. Routine dollar-cost averaging continues; a firmer tape adjusts the size of the habit, not the habit itself.

Markets at a glance

Stocks · sentiment · crypto
US Stocks · Under pressure
S&P 500
7,504
-0.4%
Nasdaq
25,819
-1.2%
Dow
52,925
-0.2%
VIX
16
Calm
Crypto
20
Extreme Fear
Bitcoin · 24h
$62,504
-1.1%
Below 200-day · −16%
Ethereum · 24h
$1,747
-1.4%
Tracking BTC
BTC Dominance
Bitcoin’s share of the total crypto market.
Bitcoin-led — a cautious tilt toward the safer coin.

Bitcoin · valuation & cycle

Where price sits in the cycle
MVRV-Z0.38UndervaluedEarly recovery
NUPL0.17Mild profit
Full breakdown · 200-day, ETF, on-chain
BTC vs 200-Day Avg−16%
BTC Price
$62,504
200-Day Avg
$74,353
⚠ BTC is more than 15% below its 200-day avg — altcoins typically bleed harder in this zone. Consider BTC-only DCA until this gap narrows.
200-day Simple Moving Average — Bitcoin’s average price over the last 200 days. A long-term trend line. Below it = downtrend; a big stretch above = parabolic, historically a cycle-top warning.
BTC · DemandETF Flows · 5d net · (live-CoinGlass)
−$260MOutflows
Jun 29Jul 06
Bitcoin · Cycle Position
AccumEarlyLateDistBear
Early Bull · MVRV-Z 0.38
Bitcoin has escaped the bottom but momentum is still building. Historically low relative to its range, with holders just turning profitable.
On-Chain Valuation
MVRV-Z
Undervalued
0.38
Compares Bitcoin’s price to what holders collectively paid. Below 0 = historically low; higher = elevated. Pre-2024 cycles topped near 7–8; the 2025 top reached only ~2.5, suggesting the ETF era may have compressed peaks.
NUPL
Mild profit
0.17
Net Unrealized Profit / Loss — how much profit holders sit on. Below 0 = underwater; higher = euphoric greed. Pre-2024 cycles peaked near 0.75; the 2025 cycle reached only ~0.56.

Institutional Dashboard

Economy · Stock Market · Crypto-Flows
9 of 10 thresholds healthy
9 HEALTHY · 0 ELEVATED · 1 TRIGGERED
BTC ETF Flows
−$260M
5-DAY NET · RED IF NET OUTFLOWS
Corporate Credit (OAS)
2.72%
TRIGGER 4.50%
Recession Signal (Sahm Rule)
0.07
TRIGGER 0.50
Oil (Brent)
$77
TRIGGER $110
US Dollar (DXY)
101.0
TRIGGER 106
Show all 10 thresholds
ISM Manufacturing
53.3
CONTRACTS BELOW 48
ISM Services
54.0
CONTRACTS BELOW 49
Stock Volatility (VIX)
16
TRIGGER 35
BTC Dominance
58.2%
TRIGGER 63%
Stablecoins
$308.3B
CRYPTO CASH READY TO BUY · 30-DAY −1.5% VS −5% TRIGGER
Dual FearInactiveVIX 16 · F&G 20
When stock-market fear and crypto fear spike at the same time, this lights up green — consider increasing your DCA. It’s rare, and historically one of the best times to invest.
Override Triggers0 of 6 · all clear
Credit crisis
Clear
Oil shock
Clear
Euphoria composite
Clear
VIX pause zone
Clear
VIX capitulation
Clear
Dual capitulation
Clear
ALL CLEAR — SCORE-BASED SIGNAL ACTIVE

Score breakdown

15 indicators · −100 to +100
The daily score combines 15 indicators on a −100 to +100 scale, with 6 safety overrides watching for extremes. Think of it like a baseball batting average — a +30 is meaningful, the same way a .300 average is great. A +60 is .400 territory — the rare readings. Most scores land between −30 and +30.
Show indicator-by-indicator scoring
Economy
+5Credit healthy (OAS 2.72%)BULLISH
+5M2 growing (+1.4%)BULLISH
+2Employment stable (0.07)BULLISH
+2Oil low ($77)BULLISH
+1Manufacturing positive (53.3%)BULLISH
Market Sentiment
+7High fear (Fear & Greed 20)BULLISH
−3BTC ETF minor outflows (−$260M)BEARISH
Crypto
−8BTC deep below 200-day avg (−16%)BEARISH
+7MVRV undervalued (0.38)BULLISH
−3Bitcoin price down 23% in 90 daysBEARISH
— 5 indicators neutral
+29 bullish+−14 bearish=+15

Score history

94 days recorded
Show score chart and trend detail
MAR 30TODAY
Chart color: green = trending up, blue = pulling back (still positive), red = trending into negative territory.
Bottom line
Signals are balanced — no strong edge either way. Routine DCA continues; no reason to change.
New here? Visit the Briefing Room →
How it works · Glossary · Backtests
This is NOT financial advice. HUD DCA™ provides market-condition assessments for educational purposes only and is not a registered investment adviser, broker-dealer, or commodity trading advisor. Backtested results are hypothetical and do not represent actual trading; digital assets carry substantial risk of total loss, and past performance does not guarantee future results. Consult a financial advisor before investing.
Questions? hello@huddca.com
© 2026 HUD DCA™ LLC · Not financial advice