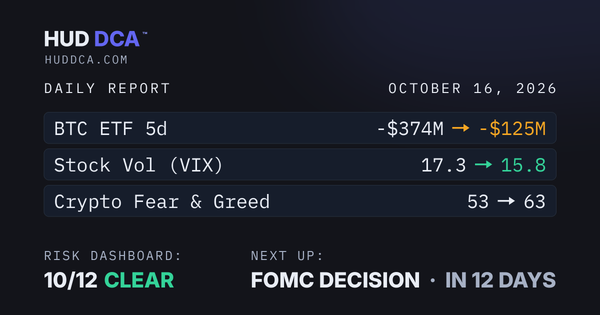
Oct 20: ETF Money Comes Back

After days of outflows, money moved back into Bitcoin funds, while Bitcoin's market share stayed past its caution line. The real test comes in eight days with the Fed decision.

Oct 20: ETF Money Comes Back

Risk dashboard

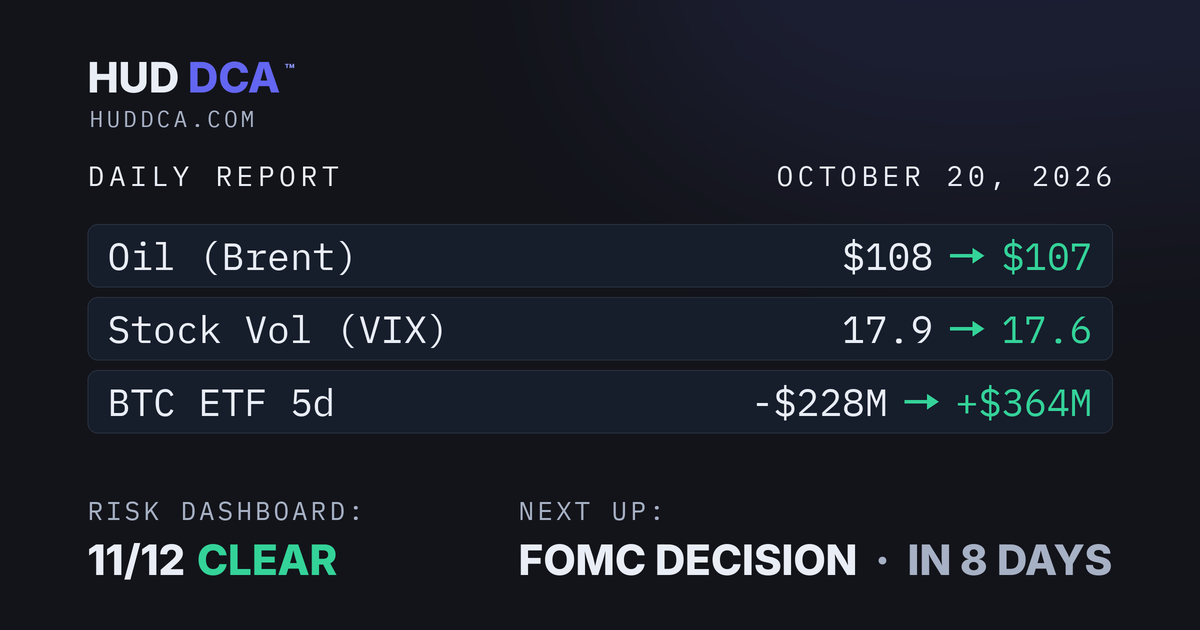
11/12clear1 caution
12 warning indicators for the economy, stocks and cryptocurrency. An indicator past its caution or alert line is worth watching, not a forecast: they often cross back and forth.
What changed today
Bitcoin’s market share held at 60.1%, past its caution line.
BTC ETF flows: flipped from $228M of outflows to $364M of inflows over five days, moving away from its caution line.
Stock fear (VIX) fell from 17.9 to 17.6, moving away from its caution line.
Oil (Brent) fell from $108 to $107, moving away from its caution line.
Bitcoin’s market share
60.1%
caution > 59.75%
BTC ETF flows, 5 days
+$364M
caution < $0
Stock fear (VIX)
17.6
caution > 29.25
Oil (Brent)
$107
caution > $110
green = clearamber = cautionred = alerttick = todaygrey line = last 30 daysdashed = the caution or alert line shown
See all 12 warning indicators1 caution · 11 clear ⌄

Recession Watch: Yield Curve

clear

2Y yield2Y

4.74%

↓ from 4.77

10Y yield10Y

5.09%

↓ from 5.10

Spread

+0.35pts

↑ from +0.33

Below 0: inverted, warning
0 to +0.50: flat, not a warning on its own
Above +0.50: normal

Rule: below 0 (inverted) is the warning. It has been positive since Sept 2024, so this card reads clear.

Why it matters: every U.S. recession since the 1970s followed a stretch below 0, usually starting a few months after the spread turned positive again. Fed's chart of past recessions ↗NY Fed: why inversions predict recessions ↗

More info on yield, spread and recessions

A yield is the interest rate the U.S. government pays to borrow for that length of time. The spread is the 10-year yield minus the 2-year, measured in percentage points: at +0.35, the 10-year pays 0.35 points more than the 2-year. Positive is normal; between 0 and +0.50 the curve is flat and close to flipping; below zero is called inverted.

The curve was inverted from mid-2022 to Sept 2024, the longest stretch on record, and has been positive for 25 months, but it has flattened from +0.74 in February. No recession has followed so far, which would make this cycle the first exception to the pattern.

Why it matters: the 2-year tracks where the Fed sets rates. The 10-year is set by investors, who buy long-term bonds when they expect the economy to slow and rates to fall later. When the 10-year drops below the 2-year, the bond market is saying it expects the Fed to be cutting rates soon, and the Fed cuts when the economy is in trouble.

Bitcoin’s market share60.1%alert > 63%
Corporate credit (OAS)3.29%alert > 4.50%
Unemployment trend (Sahm)0.00alert > 0.50
Factory activity (ISM)54.5alert < 48
Services activity (ISM)54.9alert < 49
US dollar (DXY)101.61caution > 106
Oil (Brent)$107alert > $135
Stock fear (VIX)17.6alert > 35
BTC ETF flows, 5 days+$364Malert < -$500M
Bitcoin vs 200-day average+14.3%alert < -15%
Stablecoin cash, 30-day change+0.1%alert < -5%
Factory and services activity update once a month.

Coming up

FOMC Rate Decision
In 8 days2:00 PM ET
What is this?

FOMC: the Federal Open Market Committee, the group at the Federal Reserve that sets U.S. interest rates.

It meets eight times a year to set the benchmark rate, which ripples into mortgages, car loans, credit cards and savings, and the decision posts at 2:00 PM ET. A change, or a hint about the next one, moves stocks, bonds, the dollar and digital assets at the same time.

Also in the next two weeks (3)
PCE + GDP Q3 Advance8:30 AM ETThu Oct 29
ISM Manufacturing PMI10:00 AM ETMon Nov 2
US Midterm ElectionsTue Nov 3

Stocks

S&P 500
7,746
▲ 0.7%
Nasdaq
26,580
▲ 0.6%
Dow
52,677
▲ 1.4%
Corporate credit (OAS)
3.29%alert > 4.50%
✓ Healthy
Scale
clear < 4.00%
caution 4.00% to 4.50%
alert 4.50% to 6.00%
crisis > 6.00%
scale 0% to 8%

Crypto

Bitcoin
$83,075
▲ 1.2%
200-day average
$72,651
▲ 14.3% above
Ethereum (ETH) $2,463 ▲ 2.4%Crypto Fear & Greed 55 ✓ Neutral
Bitcoin valuation (MVRV Z-Score)
0.9alert ≥ 3
BTC $83,075
-100.5234
under $55Kover $144K
Today: 0.9, middle range. Bitcoin at $83,075 is about 52% above the average cost of $55K. Neither cheap nor stretched.
Rule: caution at 2, alert at 3. Every high since the 2024 ETFs formed between 2 and 3.3; past bottoms formed below 0.
CoinGlass. Updates once a day.
What this means
What this is. MVRV Z-Score is a Bitcoin valuation gauge. It compares today’s price with the average price holders paid for the Bitcoin they own.
How it knows. Every Bitcoin transfer is recorded on its public blockchain, so the price each coin last changed hands at is known. Averaging those gives the holders’ cost.
Below 0: Bitcoin’s price is less than what the average holder paid, so the average holder is underwater. Bitcoin’s market bottoms formed here (Jan 2015, Dec 2018, Nov 2022).
0: the average holder is at break-even.
0.5 to 2: the average holder is in profit by a typical amount, roughly 1.3x to 2x what they paid. Bitcoin spends most of its time here.
2 to 3: the average holder sits on large gains, over 2x. The highs of the current ETF-era cycle formed here (Dec 2024 at 3.3, Oct 2025 at 2.5).
3 and above: beyond anything since the 2021 top. The pre-ETF cycles topped far higher, at 7 to 10 (2013, 2017, 2021).
Scale
deep low < 0 (under $55K)
low 0 to 0.5 ($55K to $70K)
middle 0.5 to 2 ($70K to $114K)
caution 2 to 3 ($114K to $144K)
alert > 3 (over $144K)
Why it matters
When most holders sit on large gains, more of them sell.
When price is near what holders paid, few want to sell at a loss.
Bitcoin has moved in rough four-year cycles: tops in 2013, 2017, 2021 and 2025, bottoms in between.
Why the lines are lower now
Since the 2024 spot Bitcoin ETFs, the peak has been about 3.
The alert line is set to the ETF era.
Bitcoin’s market share (dominance)
60.1%alert > 63%
▲ Bitcoin outpacing altcoins.
Scale
What it is. Bitcoin’s share of the total value of all cryptocurrency.
Why it matters. Rising means money is leaving smaller altcoins for Bitcoin, which tends to happen when investors turn cautious. Falling means appetite for riskier altcoins.
← Altcoins leadingrisk appetite highFlight to Bitcoin →risk-off, altcoins weak
clear < 59.75% (darker green = altcoins stronger)
caution 59.75% to 63%
alert > 63%
scale 40% to 70%

BTC ETF institutional flows

Five-day net · Oct 13 to Oct 19 · CoinGlass, live
+$364MInflows
5d+$364M
10d-$291M
30d+$1.8B
Mixed flows. No consistent institutional direction.
Daily Report GuideReference ⌄
Just the terms on this page. Fuller explanations live in the Briefing Room.
Start here
DCA: dollar-cost averaging: buying a fixed dollar amount on a regular schedule, whatever the price. It smooths out volatility rather than chasing the highest return on paper.
Treasury note: a loan to the U.S. government for a set term, and the 2-year and 10-year are the two watched here. Prices and yields move in opposite directions.
Spread: the extra interest a riskier borrower pays above the U.S. government.
On-chain: data taken from the Bitcoin blockchain rather than an exchange.
Altcoin: any cryptocurrency other than Bitcoin.
Ethereum (ETH): the second-largest digital asset, the coin of the Ethereum network.
Economy
Recession warning (2Y vs 10Y): normally the 10-year note pays more than the 2-year, and when it does not the curve is inverted. Recessions have tended to start after the curve returns to normal, with a long and variable lag, so this is a warning, not a countdown.
Corporate credit (OAS): the extra interest riskier companies pay to borrow above the U.S. government. Low means lenders are relaxed, though a very low spread has often come before weaker years.
Unemployment trend (Sahm rule): how fast unemployment is rising, not its level. Above 0.50 has signalled past U.S. recessions.
Factory and services activity (ISM): monthly surveys of the executives who place their companies’ orders, where above 50 means that sector is growing. The alert lines sit just under 50, at 48 for factories and 49 for services, as an early warning.
U.S. dollar (DXY): the dollar against a basket of major currencies, over half of it the euro. A strong dollar is a headwind for stocks and digital assets.
Oil (Brent): the global crude benchmark. Expensive oil squeezes consumers and pushes up inflation.
Stock fear (VIX): how much stock investors expect the S&P 500 to swing over the coming month, priced from options. Calm below 19.5, caution at 29.25 and alert at 35.
Crypto
Crypto Fear & Greed: a 0 to 100 sentiment index, read as a contrarian gauge. Under 25 is high fear, over 75 is greed.
BTC ETF flows, 5 days: net money into or out of the U.S. spot Bitcoin ETFs, funds you buy and sell like a stock. They hold real Bitcoin, so money flowing in means the funds are buying coins.
Bitcoin vs 200-day average: Bitcoin against its 200-day moving average, the most watched long-term trend line. Below it is a downtrend.
Bitcoin’s market share (dominance): Bitcoin’s share of total crypto market value. Rising means money is crowding into Bitcoin and away from altcoins.
Bitcoin valuation (MVRV Z-Score): a gauge of Bitcoin’s price against the average price holders paid, read from the blockchain. Deep low below 0, Low 0 to 0.5, Middle 0.5 to 2, Caution 2 to 3, Alert 3 and above.
NUPL: how much of the supply sits in profit. Shown for context; it is mathematically close to MVRV.
Stablecoin cash: dollar-pegged digital cash parked inside the system, waiting to be invested. Measured across the whole stablecoin market, so it moves when new digital dollars are created or redeemed.
Valuation level: read from MVRV Z-Score: Deep low below 0, Low 0 to 0.5, Middle 0.5 to 2, Caution 2 to 3, Alert 3 and above. It describes conditions, not a forecast.
Risk dashboard
Alert line: the level each reading is measured against, set where trouble has often followed. Crossing one means a watched condition changed, not that anything should be done.
Scheduled releases
ISM Manufacturing PMI: a monthly survey from the Institute for Supply Management. PMI stands for Purchasing Managers’ Index; the first read on factory demand.
ISM Services PMI: the same Institute for Supply Management survey, for service businesses; the read on the service economy.
Jobs report: the official monthly jobs count from the Bureau of Labor Statistics, often called payrolls or NFP (nonfarm payrolls); the month’s hiring and unemployment numbers.
CPI: the Consumer Price Index, the government’s main measure of inflation, from the Bureau of Labor Statistics; the main inflation number.
PPI: the Producer Price Index, from the Bureau of Labor Statistics; wholesale inflation.
PCE: the Personal Consumption Expenditures price index, from the Bureau of Economic Analysis; the inflation gauge the Federal Reserve targets.
GDP: Gross Domestic Product, from the Bureau of Economic Analysis; the economy’s growth rate.
FOMC: the Federal Open Market Committee, the group at the Federal Reserve that sets U.S. interest rates; the interest rate decision.
SEP and dot plot: the Summary of Economic Projections, published at four Fed meetings a year; the Fed’s own rate forecasts.
Fiscal year end: the end of the U.S. government’s budget year, on September 30; quarter-end fund rebalancing and the shutdown deadline.
Treasury refunding: the U.S. Treasury’s quarterly plan for how much the government will borrow; the government’s borrowing plan.
Midterm elections: the U.S. elections held halfway through a president’s term; control of Congress.
CLARITY Act: the Digital Asset Market Clarity Act, a U.S. bill to set clear rules for crypto; the rules for digital assets.
Quarter-end rebalancing: large funds resetting their holdings at the end of each quarter; quarter-end fund flows.

Go deeper in the Briefing Room →
Terms are defined in the Daily Report Guide above; the Briefing Room covers each indicator in depth.
This is NOT financial advice. HUD DCA™ provides market-condition assessments for educational purposes only and is not a registered investment adviser, broker-dealer, or commodity trading advisor. Digital assets carry substantial risk of total loss, and past performance does not guarantee future results. Consult a financial advisor before investing.
Questions? hello@huddca.com
© 2026 HUD DCA™ LLC · Not financial advice