How to Read the Crypto Fear & Greed Index (and When to Ignore It)
The 0-to-100 crypto sentiment score in plain English: what it measures, how to read it without fooling yourself, how it has behaved in 2026, and when to tune it out.

There is a single number that crypto traders check the way the rest of us check the weather. It is the Crypto Fear & Greed Index: a score from 0 to 100 that tries to capture the mood of the entire market in one glance. Zero is blind panic. One hundred is euphoria. On any given morning, it is the first thing many people look at before deciding whether to buy, sell, or sit still.
It is genuinely useful, and it is genuinely easy to misread. Most beginners get the direction backwards, treat it as a crystal ball, and forget that the number is really just a blend of a few ingredients, half of which are recycled price action. This guide walks through what the index actually measures, how to read it without fooling yourself, how it has behaved so far in 2026 (a year that has lived almost entirely in fear), and the specific situations where the smartest move is to ignore it.
What the index actually is
At its simplest, the index is a mood meter. It runs from 0 to 100 and updates once a day. Low means the crowd is fearful, high means the crowd is greedy, and the labels come straight from the score: roughly, under 25 is "Extreme Fear," the middle around 50 is "Neutral," and above 75 is "Extreme Greed," with plain "Fear" and "Greed" filling the gaps.
The version almost everyone quotes is published by Alternative.me, which has run it since 2018 and offers the data through a free API. That matters for one reason most people miss: it is not the only version. CoinMarketCap runs its own, and several bitcoin-only trackers run theirs, and they do not always agree. On the same day this guide pulled its data, Alternative.me read about 20 while another popular tracker read in the mid-30s. Same concept, different recipe. So the first practical rule is boring but important: know which index you are looking at.
The whole thing is built on one contrarian idea, and Alternative.me states it plainly. Extreme fear can mean investors are too worried, which may be a buying opportunity. Extreme greed can mean the market is due for a correction. In other words, the index is designed to be read against the crowd, not with it.
What actually goes into the number
The score is a weighted blend of a handful of inputs. Here is the recipe Alternative.me uses:
Volatility (25%). How jumpy the price is compared with its own 30-day and 90-day norms. A sudden jump in volatility reads as fear.
Market momentum and volume (25%). Current buying volume and momentum against recent averages. Heavy, eager buying reads as greed.
Social media (15%). Mostly activity and interaction rates on Bitcoin-related posts on X (Twitter). Unusually high engagement reads as greed.
Surveys (15%), currently paused. Weekly market polls that Alternative.me has switched off. This slice contributes nothing to today's live number, even though it still shows up in the published weights.
Bitcoin dominance (10%). A rising Bitcoin share of the market reads as caution, since money is hiding from riskier altcoins.
Google Trends (10%). Search interest in Bitcoin-related terms.
The tell: volatility plus momentum is fully half the score, and both are derived straight from price. Alternative.me even explains that the index is bitcoin-focused because "a big part of it is the volatility of the coin price." Put plainly: when the price falls hard, the index mechanically turns fearful, partly because the price fell. It is measuring the storm partly by how hard the rain is already coming down. Keep that in your back pocket, because it explains a lot of the index's blind spots.
How to read it the right way
Here is the twist that catches almost every beginner: at the extremes, the index is a contrarian signal, not a momentum one. It is telling you what the crowd feels so you can consider doing the opposite.
Extreme fear (under about 25). Everyone is scared, the headlines are declaring crypto dead again, and selling feels like the responsible thing to do. Historically, these zones have clustered closer to bottoms than to tops. Buying here feels the most dangerous, which is precisely the point.
Extreme greed (over about 75). Everyone is euphoric, strangers are handing out coin tips, and buying feels safe and obvious. Historically, these zones have clustered closer to local tops. That is the trap: it feels safest exactly when the crowd is most exposed.
The mushy middle (roughly 40 to 60). This is where the index tells you the least and where people over-interpret it the most. A neutral reading is usually just noise wearing a number.
This is the old "be fearful when others are greedy, and greedy when others are fearful" idea, made measurable. It is a thermometer, not a clock. It can tell you the mood is hot or cold. It cannot tell you when the weather turns.
How it has trended in 2026
If you want a single word for the index this year, it is fearful. Using Alternative.me's daily readings, the index has spent 127 of the first 189 days of 2026 in Extreme Fear, roughly two of every three days. In that same stretch it logged exactly one day of "Greed" and zero days of Extreme Greed. This has been a year of the gauge stapled to the floor.
The arc within the year is worth walking through, because it is a live lesson in the index's limits:
January: the high point, and even that was modest. The year's optimism peaked early, with the index reaching 61 (mild Greed) on January 15 before rolling over. That was as good as the mood got all year. January averaged 31.
February: capitulation. Sentiment collapsed to a yearly low of 5 on February 23, about as deep into Extreme Fear as the gauge goes. The whole month averaged just 10.
Spring thaw. Fear eased slowly through spring, and on one day in May the index finally tagged 50 (Neutral) for the first time in months. May was the calmest stretch of the year, averaging 34.
Early-summer relapse. June slid back into deep fear, averaging 16 and dipping into single digits, and early July has hovered in the low 20s. As of this writing the index reads about 20: Extreme Fear.
Now notice the lesson hiding in that timeline. The index sat at Extreme Fear for months at a time while the market kept grinding lower. If "extreme fear equals buy" were a precise timing signal, it would have had you buying in February, and again in March, and again in June, well before any durable turn. Fear can stay extreme for a very long time. Which brings us to the part most guides skip.
When to ignore it
When it has been pinned at an extreme for weeks. The useful information is in the move into an extreme, not in the index camping there. 2026 is the case study: months of Extreme Fear did not mark a single clean bottom. A gauge stuck at 12 tells you the mood, not the timing.
When you have not checked which index it is. Alternative.me, CoinMarketCap, and the various bitcoin-only trackers weight their inputs differently and can differ by 15 points or more on the same day. A screenshot with no source attached is close to meaningless.
When the number is just echoing the price. Remember that half the score is volatility and momentum, both derived from price. On a hard down day, a "fear" reading is partly just restating that the price went down, which you already knew. That is not independent confirmation of anything.
When you are in the mushy middle. Between roughly 40 and 60, the index is not saying much. Do not manufacture a signal out of a neutral one.
When it is the only thing you are looking at. Sentiment says nothing about liquidity, the Fed, valuation, or ETF flows. It is one input, not a strategy. On its own it cannot tell you whether the tide is coming in or going out. It only tells you how nervous everyone is while it happens.
Add to all of that the imperfections under the hood: a 15% survey slice that is currently switched off, and a social-media input that can be noisy or deliberately gamed. None of this makes the index useless. It makes it a rough mood ring, not a precision instrument, and it deserves to be read that way.
Putting it together: how to actually use it
The best use of the Fear & Greed Index is as a gut-check against your own emotions, which tend to be loudest exactly when they are most wrong. When the index is screaming Extreme Greed and you feel invincible, treat that as a cue to slow down. When it is screaming Extreme Fear and every instinct says sell everything, treat that as a cue to breathe before you act.
But the dependable edge in this market was never a number that calls tops and bottoms. It is a steady routine: buying a fixed amount on a regular schedule regardless of what the gauge says, so that fear and greed stop making the decision for you. Dollar-cost averaging quietly turns a scary Extreme Fear reading from a reason to panic into, at most, a slightly cheaper purchase.
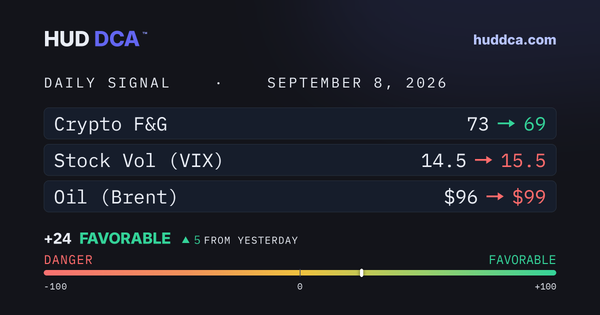
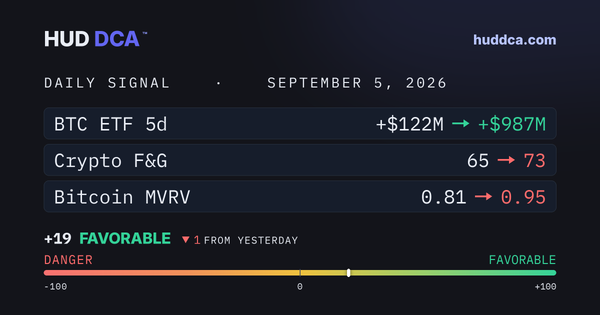
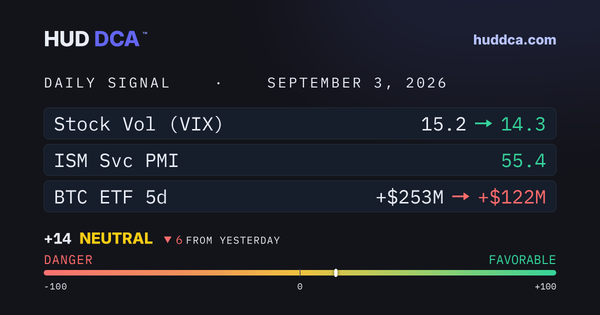
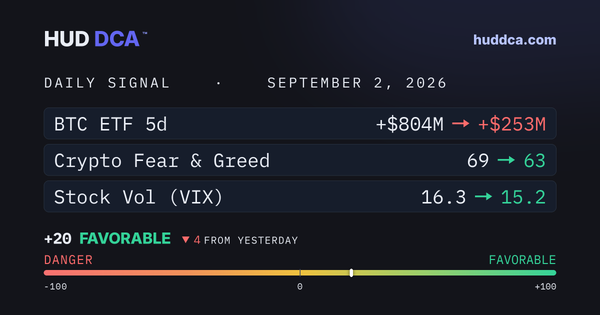
That is also why we treat sentiment as one input among many rather than the whole picture. The Fear & Greed Index is one of the readings tracked in the daily HUD DCA report, sitting alongside the macro and on-chain forces that actually move the price (18 indicators plus a 70-plus event macro-catalyst calendar), so you can see at a glance whether the crowd's mood matches what liquidity, valuation, and flows are really doing. It has been live since March 2026.
Here is the honest bottom line. The Fear & Greed Index is a mirror, not a map. It is very good at telling you how the crowd feels right now, and knowing that is valuable precisely so you can avoid catching the same feeling at the worst moment. It is bad at telling you what happens next, and 2026 has been a year-long reminder of exactly that. Use it to check your own pulse, not to time the market.
Sources & further reading
Crypto Fear & Greed Index (Alternative.me): the canonical 0-to-100 sentiment score and its full methodology, including the current component weights and the paused survey input.
Fear & Greed Index API (Alternative.me): the free historical-data endpoint behind every 2026 figure quoted in this article.
Crypto Fear and Greed Index (CoinMarketCap): a widely used alternative version, handy for seeing how much two providers can disagree on the same day.
Crypto Fear and Greed Index, explained (Forbes): a plain-English overview of what the score is and how investors use it.
What Actually Moves Bitcoin's Price (HUD DCA): our companion guide to the seven forces behind the chart, including where sentiment fits among them.
Want to see today's sentiment in context, right next to the macro and on-chain forces that actually move the price? Read the latest HUD DCA daily report.
This article is general market education, not financial advice. HUD DCA provides market-condition assessments for informational purposes only and is not a registered investment adviser. Digital assets are highly volatile and carry real risk of loss. Always do your own research, and consider speaking with a qualified financial professional before making investment decisions.