What Actually Moves Bitcoin's Price: A Plain-English Guide to the Forces Behind the Chart
The seven forces that actually move Bitcoin's price - liquidity, the Fed, credit, valuation, ETF flows, sentiment, and supply - in plain English.

Bitcoin can feel like it moves on nothing. It climbs for a week with no obvious reason, then drops 15% on a quiet Sunday while the headlines stay silent. To a newcomer, the chart looks like pure chaos — or worse, like it's rigged.
It isn't random. A handful of forces push and pull Bitcoin's price, and most of them are the same forces that move every risk asset on earth, plus a few that are unique to crypto. Once you can name them, the chart stops looking like noise and starts looking like a tug-of-war you can actually follow.
This is a guide to the seven that matter most — in plain English, with every piece of jargon explained the first time it appears. One promise up front: none of these predicts the future, and anyone who tells you a single indicator can call the next move is selling something. What these forces do tell you is what kind of environment you're buying into — a far more useful question than "what will the price do tomorrow?"
1. The macro tide: liquidity, the Fed, and the dollar
The single biggest force acting on Bitcoin is also the slowest: how much money is sloshing around the financial system. The market's word for this is liquidity. When money is easy and plentiful, investors reach further out the risk spectrum chasing returns — and Bitcoin sits at the very far end of that spectrum. When money tightens, the tide goes out, and the riskiest assets are the first to be left on the sand.
Three levers control the tide:
- Interest rates and the Federal Reserve (the "Fed," America's central bank). Low rates lower the cost of borrowing and nudge investors toward riskier, higher-upside bets like crypto. "Higher for longer" does the opposite. This is why a single Fed meeting can swing Bitcoin within minutes — traders aren't reacting to Bitcoin at all, they're repricing how much easy money is coming.
- The money supply (M2). This is the broad measure of how many dollars exist in the system. When M2 is expanding, that fresh liquidity has historically found its way into crypto — but with a lag, often a couple of months. It's a slow tailwind, not an instant one.
- The US dollar (measured by the Dollar Index, or DXY). Bitcoin is priced in dollars and, for some buyers, competes with the dollar as a place to park value. A strengthening dollar tends to weigh on Bitcoin; a weakening one gives it room to run.
You won't see the tide move day to day. But it quietly sets the ceiling and the floor that everything else operates within.
2. Risk appetite and credit: when Wall Street gets nervous
Despite the "digital gold" branding, Bitcoin mostly trades like a risk asset — it rises when investors feel bold and falls when they get scared, often moving in near-lockstep with high-growth tech stocks. Two gauges reveal that collective mood before it fully shows up in the price.
- The VIX is the stock market's "fear gauge." It measures how much turbulence investors expect over the coming month. A low VIX means calm, risk-on conditions; a spiking VIX means panic — and crypto almost always falls alongside everything else. (One counterintuitive wrinkle: the most extreme fear spikes have sometimes lined up with good entry points, because peak panic tends to coincide with washed-out prices.)
- Credit spreads — tracked through a measure called the Option-Adjusted Spread (OAS) — show the extra interest risky companies must pay to borrow compared with the US government. When that spread is narrow, credit markets are calm and money flows freely. When it blows out, it's a signal that professional investors smell trouble, and that stress tends to spill into crypto quickly. Credit markets are often called the "smart money," because they flash warnings early.
Calm VIX plus narrow credit spreads is a supportive backdrop. A spiking VIX or widening spreads is risk-off — and Bitcoin usually feels it.
3. Valuation: what holders actually paid
Stocks have price-to-earnings ratios to tell you whether they're expensive. Bitcoin has no earnings, but it has something stocks don't: a public ledger. That makes on-chain valuation possible, and the most useful tool is MVRV (Market Value to Realized Value).
In plain English, MVRV compares Bitcoin's current price to the average price at which every coin last moved — roughly, what the typical holder paid for theirs.
- When MVRV is low, the price is near or below what holders paid. The market is "undervalued" by this measure, and historically those zones have appeared closer to bottoms than tops.
- When MVRV is high and stretched, most holders are sitting on large paper gains — the kind of broad euphoria that has historically clustered near cycle peaks.
It's one of the cleaner ways to answer "are we expensive or washed out right now?" without staring at the raw price. It will not call the exact top or bottom — nothing will — but it's a reliable read on which half of the cycle you're probably standing in.
4. Who's actually buying: institutional flows
For most of Bitcoin's life, its buyers were retail traders and crypto-native funds. That changed in January 2024, when the SEC approved the first US spot Bitcoin ETFs (Exchange-Traded Funds). An ETF holds real Bitcoin and trades like an ordinary stock, which means pension funds, financial advisors, and regular brokerage accounts can now own Bitcoin without ever touching a crypto exchange. They've quickly become one of the market's biggest marginal buyers — and sellers.
- Sustained inflows mean fresh institutional money is moving in. That's a genuine tailwind.
- Sustained outflows mean big money is stepping back — often a sign of caution that shows up before, or alongside, weakness in the price.
Because flow data is published daily, it's one of the most-watched real-time reads on institutional appetite. Quarter-end and rebalancing periods can amplify the swings. The useful question it answers is blunt: are the big players actually leaning in right now, or just talking a good game?
5. Crypto's own mood: the Fear & Greed twist
Crypto has its own emotional thermometer: the Crypto Fear & Greed Index, a score from 0 to 100 where low means panic and high means euphoria. It blends volatility, momentum, social-media chatter, and surveys into a single number.
Here's the twist that catches almost every beginner: at the extremes, sentiment is a contrarian signal.
- Extreme greed — when everyone is euphoric and strangers are giving you coin tips — has historically clustered near local tops. That's precisely when buying feels safest.
- Extreme fear — when the mood is capitulation and the headlines are declaring crypto dead again — has historically clustered near better entry points. That's precisely when buying feels most dangerous.
This is the old "be greedy when others are fearful" idea, made measurable. It is not a timing tool — fear can stay pinned at the extreme for weeks — but it's a powerful gut-check against your own emotions, which tend to be most wrong exactly when they're loudest.
6. The structural slow burn: supply and dominance
Some forces barely move week to week but shape the entire cycle.
- The halving. Roughly every four years, the rate at which new Bitcoin is created is cut in half (the most recent was in 2024). Less new supply hitting the market, against steady or rising demand, has historically preceded Bitcoin's big bull runs. The catch: the effect plays out over many months, not days, and as more people learn to anticipate it, more of it gets "priced in" ahead of time.
- Bitcoin dominance. This is Bitcoin's share of the total value of all crypto. When dominance is high and rising, money is crowding into Bitcoin and away from smaller coins ("altcoins") — usually a cautious, risk-off, Bitcoin-led market. When dominance falls, money is rotating out into altcoins, a sign of rising risk appetite that often shows up later in a cycle. Dominance won't tell you where the market is going, but it tells you what kind of market you're in, and which coins are likely to lead or lag.
These slow structural forces are the backdrop that all the faster signals play out against.
7. Scheduled catalysts: the events you can see coming
Not everything that moves Bitcoin is a slow tide. Some are events with a date attached.
- Macro data releases. Inflation reports like the Consumer Price Index (CPI) and the Personal Consumption Expenditures index (PCE), jobs numbers, and Fed meetings can jolt crypto in the minutes after they print, because each one reshapes the rate-and-liquidity picture from Section 1.
- Regulation. New rules — a sweeping regional framework, a piece of US legislation, a major court decision — can shift the long-term outlook for how and where digital assets trade.
- Crypto-specific events. ETF decisions, major network upgrades, and big exchange news all qualify.
The valuable thing about scheduled catalysts is that they're knowable in advance. You can't predict the outcome, but you can know the date — which is exactly why keeping a forward calendar is worth the effort. It lets you brace for volatility instead of getting blindsided by it. A common, level-headed approach is to let any extra, discretionary buying wait until after a big event clears, rather than gambling on the result.
Putting it together: it's the mix, not the magic signal
Here's the part most "Bitcoin price prediction" content leaves out: no single lever moves the price. It's the interplay. A strong dollar fighting a dovish Fed. Extreme fear fighting heavy ETF outflows. A halving tailwind fighting a risk-off stock market. On any given day, some of these forces pull up and others pull down, and the price you see is just the net result of that tug-of-war.
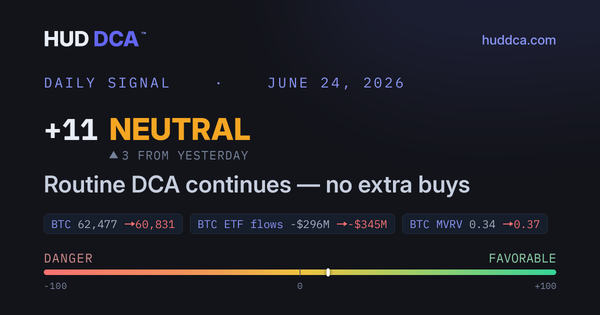
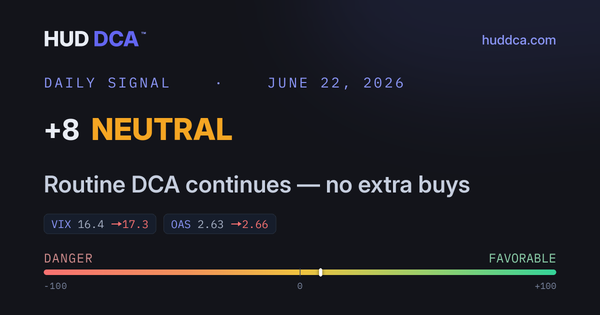
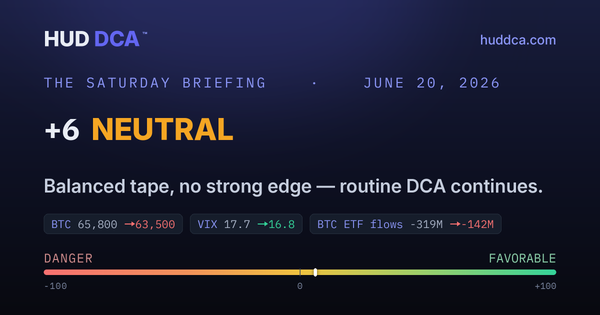
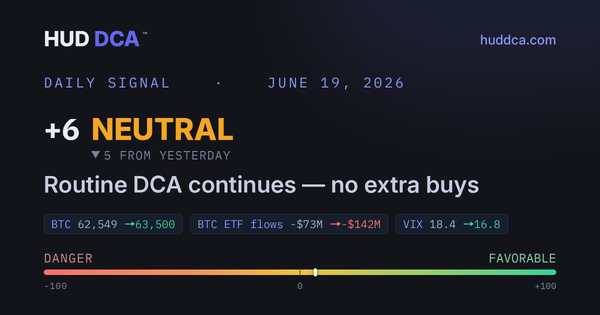
That's why no one indicator "works" on its own, and why anyone selling you a single magic signal is overselling. It's also why watching everything together is so much more useful than fixating on one number. (This is the idea behind the daily read we publish at HUD DCA: it tracks these macro and on-chain forces in one place — 14 live indicators plus a 70+ event macro-catalyst calendar — and distills them into a single read on market conditions. It's been live since March 2026, and in backtesting it flagged 21 of 24 major market events across 2017–2025.)
But here is the honest part, and it's the most important line in this guide: none of this predicts the top or the bottom. The forces above can tell you when conditions have historically been stretched, or washed out — they cannot tell you the day the market turns. History rhymes; it doesn't repeat on a schedule. Anyone who claims to time the peak precisely is just guessing with confidence.
So what is all of this actually good for? Awareness. Knowing whether you're buying into euphoria or into fear, into a tightening tide or a loosening one, changes how you hold a position — and how you hold a position is what wrecks or saves most investors. The most dependable edge in this market isn't a signal that calls tops. It's a steady routine — like buying a fixed amount on a regular schedule, regardless of price — paired with enough awareness to stay calm when the chart turns ugly, and to ease off sensibly when conditions look historically stretched.
The forces don't tell you what to do. They tell you what's happening. And most of the time, understanding what's happening is enough to make a calmer, better decision than fear or greed would have made for you.
Sources & further reading
- M2 money supply (FRED, Federal Reserve Bank of St. Louis) — the broad measure of dollars in the system.
- High-yield credit spreads — Option-Adjusted Spread (FRED) — the ICE BofA US High Yield Index OAS, a real-time read on credit stress.
- The VIX, explained (Investopedia) — how the stock market's "fear gauge" works.
- Crypto Fear & Greed Index (Alternative.me) — the live 0-100 sentiment score.
- MVRV ratio (Glassnode) — how on-chain valuation compares price to what holders paid.
- SEC approval of spot Bitcoin ETPs, January 2024 (U.S. SEC) — the official statement that opened the door to institutional flows.
- Bitcoin's four-year cycle and halvings (Fidelity) — a balanced look at the supply schedule and its limits.
Want to see all of these forces tracked in one place, every day? Read today's HUD DCA report.
This article is general market education, not financial advice. HUD DCA provides market-condition assessments for informational purposes only and is not a registered investment adviser. Digital assets are highly volatile and carry real risk of loss. Always do your own research, and consider speaking with a qualified financial professional before making investment decisions.