June 19, 2026
Stocks rallied and the fear gauge cooled after the Fed — but crypto's still buried in extreme fear and ETF outflows widened. Today's signal: Neutral.

How this score works
Today’s Signal · Jun 19
+6
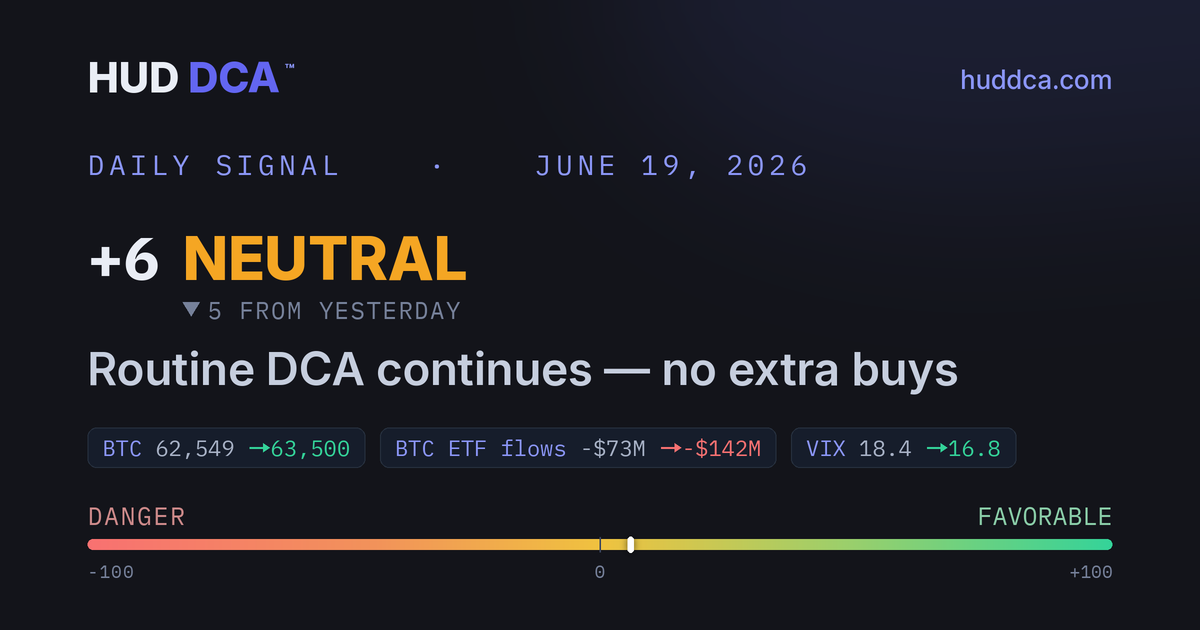
▼ -5 from yesterday
NEUTRAL
−1000+100
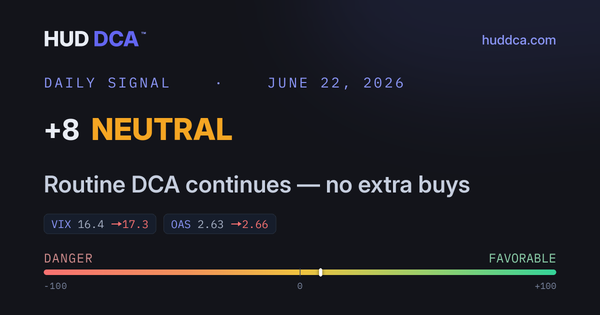
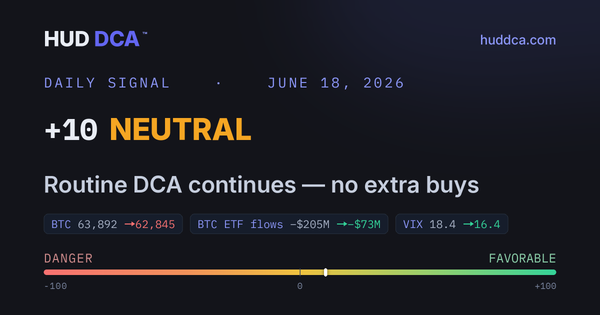
Routine DCA continues — no extra buys
Signals are balanced — no strong edge either way. Routine DCA continues; no reason to change.
What moved today
BTC62,549→63,500BTC ETF flows−$73M→−$142MVIX18.4→16.8
Today’s analysis
Risk appetite is thawing — stocks rallied and Wall Street’s fear gauge cooled two days after the Fed
Stocks pushed broadly higher with technology shares leading, the market’s fear gauge slipped back toward calm, and the dollar eased — a quietly constructive backdrop for risk assets, even with crypto sentiment still buried in extreme fear.
Institutions are still heading for the exit — Bitcoin ETF outflows deepened even as the mood lifted
The discordant note today: outflows from the US spot Bitcoin exchange-traded funds widened, a sign large investors are still trimming exposure while Bitcoin remains well below its long-term trend.
The week’s main event: an inflation reading six days out that will judge the Fed’s new stance
Attention now shifts to next Thursday’s PCE inflation report — the first major price read since the Fed’s hawkish turn — with quarter-end fund flows, Europe’s crypto-rules deadline, and the June jobs report close behind.
Read the full breakdown
Risk appetite is thawing — stocks rallied and Wall Street’s fear gauge cooled two days after the Fed
- The post-Fed scare keeps fading and the broader tape is healing. The VIX (the stock market’s “fear gauge,” where lower means calmer) eased further into untroubled territory as the major indexes climbed, and the US dollar slipped — a softer dollar, tracked by the Dollar Index or DXY, has historically been a tailwind for Bitcoin. Underneath all of it the contrarian setup is still intact: the Crypto Fear & Greed Index (a 0–100 sentiment gauge where low means panic) stays pinned in extreme fear and an on-chain measure called MVRV (Market Value to Realized Value, which compares price to what the average holder paid) still reads undervalued — washed-out sentiment paired with an undervalued reading has historically marked better places to keep buying than moments of euphoria.
Institutions are still heading for the exit — Bitcoin ETF outflows deepened even as the mood lifted
- Follow the institutional money. The US spot Bitcoin ETFs (exchange-traded funds that let investors hold Bitcoin as easily as a stock) saw their outflows widen versus the day before, so even on an up day for price the big buyers have not turned around. Bitcoin also remains meaningfully below its 200-day average (the average price over the past 200 days, a line traders use to read the broader trend), which means the downtrend is not clearly broken yet — and in stretches like this, “altcoins” (everything that is not Bitcoin) typically lag while Bitcoin leads any recovery. Neither point is alarming, but together they argue for patience over chasing the bounce.
The week’s main event: an inflation reading six days out that will judge the Fed’s new stance
- June 25 is the one to circle. PCE (Personal Consumption Expenditures), the inflation gauge the Fed watches most closely, lands alongside the final estimate of first-quarter GDP (Gross Domestic Product, the broadest measure of economic output); a cooler-than-expected reading would ease the pressure for the rate increase the Fed’s latest forecast now floats, while a hot one would harden it — and either way, routine dollar-cost averaging carries on straight through the print, which is the whole point of a schedule.
Markets at a glance
Stocks · sentiment · crypto
US Stocks · Calm and steady
S&P 500
7,501
+1.1%
Nasdaq
26,518
+1.9%
Dow
51,565
+0.1%
VIX
17
Calm
Crypto
23
Extreme Fear
Bitcoin · 24h
$63,500
+1.0%Below 200-day
Ethereum · 24h
$1,710
+0.1%Tracking BTC
BTC Dominance
Bitcoin’s share of the total crypto market.
BITCOIN HOLDS THE LARGER SHARE OF THE MARKET.
Bitcoin · valuation & cycle
Where price sits in the cycle
MVRV-Z0.38UndervaluedEarly recovery
NUPL0.16Mild profit
Full breakdown · 200-day, ETF, on-chain
BTC vs 200-Day Avg−18%
BTC Price
$63,500
200-Day Avg
$77,120
⚠ BTC is more than 15% below its 200-day avg — altcoins typically bleed harder in this zone. Consider BTC-only DCA until this gap narrows.
200-day Simple Moving Average — Bitcoin’s average price over the last 200 days. A long-term trend line. Below it = downtrend; a big stretch above = parabolic, historically a cycle-top warning.
BTC · DemandETF Flows · 5d net · (live-CoinGlass)
−$142MOutflows
Jun 12Jun 18
Bitcoin · Cycle Position
AccumEarlyLateDistBear
Early Bull · MVRV-Z 0.38
Bitcoin has escaped the bottom but momentum is still building. Historically low relative to its range, with holders just turning profitable.
On-Chain Valuation
MVRV-Z
Undervalued
0.38
Compares Bitcoin’s price to what holders collectively paid. Below 0 = historically low; higher = elevated. Pre-2024 cycles topped near 7–8; the 2025 top reached only ~2.5, suggesting the ETF era may have compressed peaks.
NUPL
Mild profit
0.16
Net Unrealized Profit / Loss — how much profit holders sit on. Below 0 = underwater; higher = euphoric greed. Pre-2024 cycles peaked near 0.75; the 2025 cycle reached only ~0.56.
Institutional Dashboard
Economy · Stock Market · Crypto-Flows
9 of 10 thresholds healthy
9 HEALTHY · 0 ELEVATED · 1 TRIGGERED
BTC ETF Flows
−$142M
5-DAY NET · RED IF NET OUTFLOWS
Corporate Credit (OAS)
2.63%
TRIGGER 4.50%
Recession Signal (Sahm Rule)
0.10
TRIGGER 0.50
Oil (Brent)
$81
TRIGGER $110
US Dollar (DXY)
100.8
TRIGGER 106
Show all 10 thresholds
ISM Manufacturing
54.0
CONTRACTS BELOW 48
ISM Services
54.5
CONTRACTS BELOW 49
Stock Volatility (VIX)
17
TRIGGER 35
BTC Dominance
58.3%
TRIGGER 63%
Stablecoins
$310.7B
CRYPTO CASH READY TO BUY · 30-DAY −2.1% VS −5% TRIGGER
Dual FearInactive
When stock-market fear and crypto fear spike at the same time, this lights up green — consider increasing your DCA. It’s rare, and historically one of the best times to invest.
Override Triggers0 of 6 · all clear
Credit crisis
ClearOil shock
ClearEuphoria composite
ClearVIX pause zone
ClearVIX capitulation
ClearDual capitulation
ClearALL CLEAR — SCORE-BASED SIGNAL ACTIVE
Score breakdown
14 indicators · −100 to +100
The daily score combines 14 indicators on a −100 to +100 scale, with 6 safety overrides watching for extremes. Think of it like a baseball batting average — a +30 is meaningful, the same way a .300 average is great. A +60 is .400 territory — the rare readings. Most scores land between −30 and +30.
Show indicator-by-indicator scoring
Economy
+5Credit healthy (OAS 2.63%)BULLISH
+5M2 growing (+1.8%)BULLISH
+2Employment stable (0.10)BULLISH
+1Manufacturing positive (54.0%)BULLISH
Market Sentiment
+7High fear (Fear & Greed 23)BULLISH
−3BTC ETF minor outflows (−$142M)BEARISH
Crypto
−10Bitcoin price down 18% in 30 daysBEARISH
−8BTC deep below 200-day avg (−18%)BEARISH
+7MVRV undervalued (0.38)BULLISH
— 5 indicators neutral
+27 bullish+−21 bearish=+6
Score history
77 days recorded
Show score chart and trend detail
MAR 30TODAY
Chart color: green = trending up, blue = pulling back (still positive), red = trending into negative territory.
Bottom line
Signals are balanced — no strong edge either way. Routine DCA continues; no reason to change.
New here? Visit the Briefing Room →
How it works · Glossary · Backtests
This is NOT financial advice. HUD DCA™ provides market-condition assessments for educational purposes only and is not a registered investment adviser, broker-dealer, or commodity trading advisor. Backtested results are hypothetical and do not represent actual trading; digital assets carry substantial risk of total loss, and past performance does not guarantee future results. Consult a financial advisor before investing.