July 28: US - 10Y/2Y Yield Spread
Now you can track BTC institutional demand with brand-new 5d, 10d, and 30d BTC ETF flow bars, plus a clearer look at the 2Y vs 10Y Treasury curve.

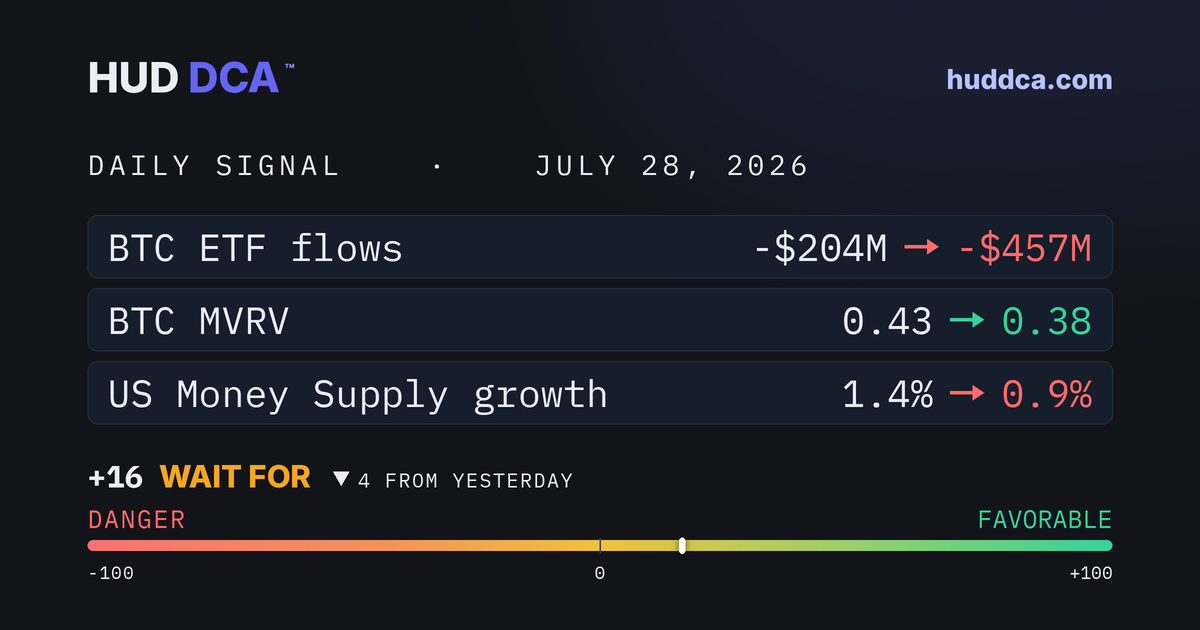

Now you can track BTC institutional demand with brand-new 5d, 10d, and 30d BTC ETF flow bars, plus a clearer look at the 2Y vs 10Y Treasury curve.
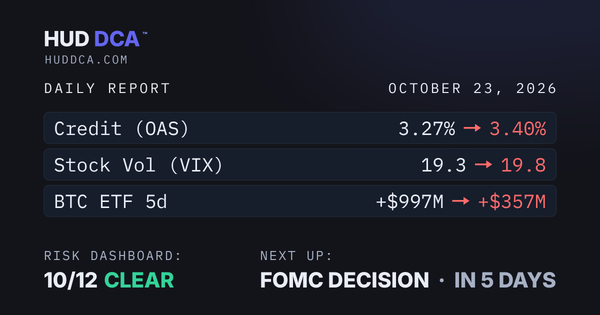
Bitcoin ETFs saw their biggest one-day outflow of the month and greed drained out of the market, yet Bitcoin barely budged. Is it a healthy breather before next week's Fed decision, or a sign buyers are stepping back?
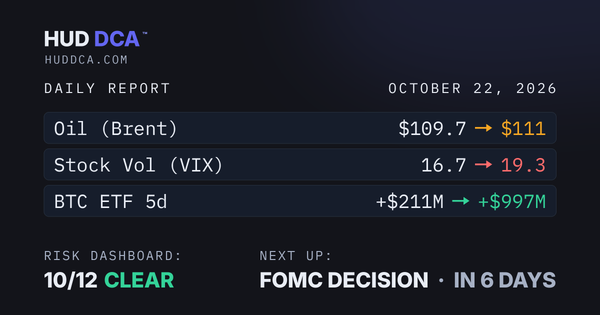
Stocks and Bitcoin both slid, yet money kept pouring into Bitcoin funds, and oil crossed its caution line. Is this a dip being bought or the start of something rougher, with the Fed decision less than a week away?
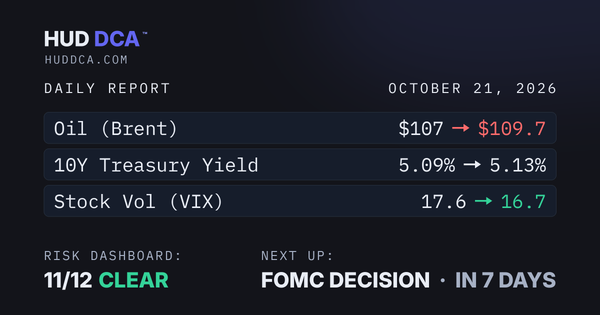
Brent crude is pressing up against its caution line, and Bitcoin's share of the cryptocurrency market has already crossed its caution line. The open question is whether either backs off before the Fed decision next week.
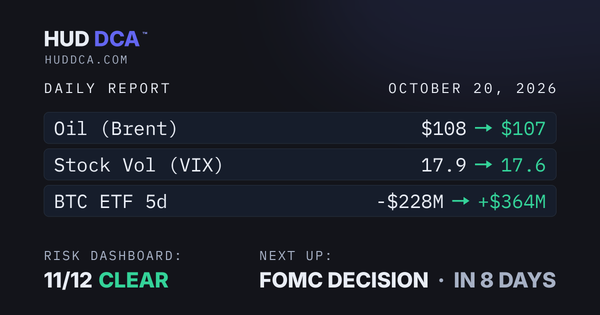
After days of outflows, money moved back into Bitcoin funds, while Bitcoin's market share stayed past its caution line. The real test comes in eight days with the Fed decision.