May 13, 2026
PPI ran 3x consensus — biggest monthly print since March 2022. Engine paused DCA before CPI Tuesday and PPI today, now flipped to NEUTRAL. First NEUTRAL day of the live cycle. This is what discipline pays for.

PPI ran 3x consensus — biggest monthly print since March 2022. Engine paused DCA before CPI Tuesday and PPI today, now flipped to NEUTRAL. First NEUTRAL day of the live cycle. This is what discipline pays for.
The committee of twelve that replaced the gold standard, how it sets interest rates, and why traders watch its calendar so closely.
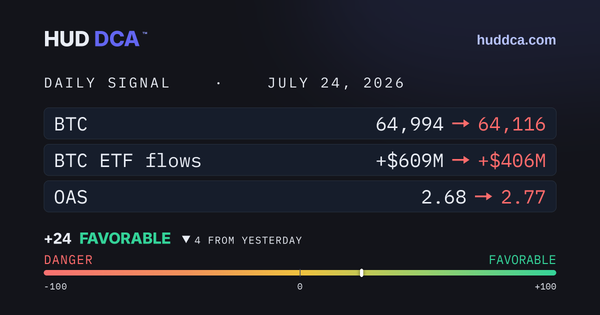
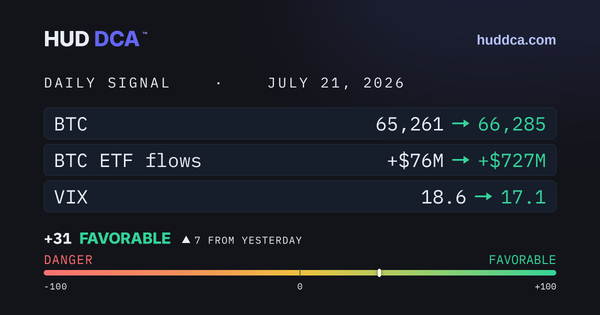
All ten risk thresholds read healthy today (see the 10-institional dashboard below) — credit, the Sahm rule, oil, the dollar, both ISM readings, volatility, BTC ETF flows and dominance, and stablecoins.
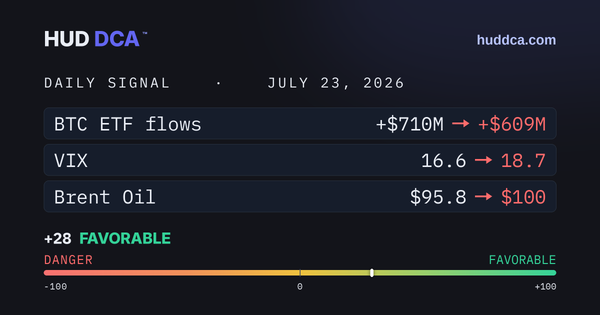
Brent oil: ~$71 (Jul 1) → $101 today, about +41% in three weeks.
Corporate Credit is healthy (OAS 2.69%) | VIX is calm (17) | Employment stable (0.07)