June 2, 2026
Bitcoin dropped another 5% today — yet stocks are calm and the economy just hit a four-year high. The whole story is an institutional exit from Bitcoin ETFs, now nearly $2 billion in five...

Bitcoin dropped another 5% today — yet stocks are calm and the economy just hit a four-year high. The whole story is an institutional exit from Bitcoin ETFs, now nearly $2 billion in five...

The committee of twelve that replaced the gold standard, how it sets interest rates, and why traders watch its calendar so closely.
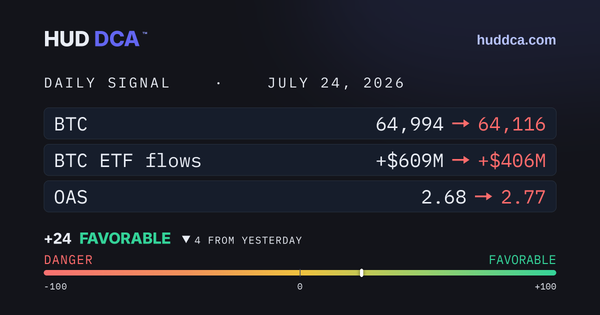
All ten risk thresholds read healthy today (see the 10-institional dashboard below) — credit, the Sahm rule, oil, the dollar, both ISM readings, volatility, BTC ETF flows and dominance, and stablecoins.
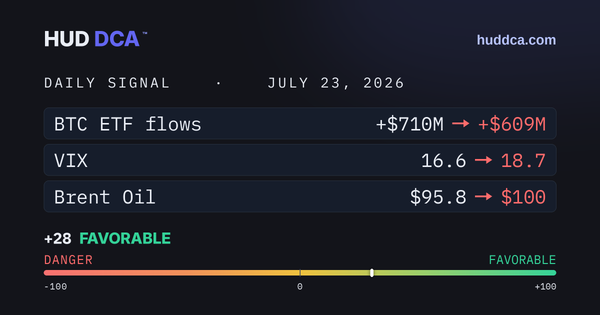
Brent oil: ~$71 (Jul 1) → $101 today, about +41% in three weeks.
Corporate Credit is healthy (OAS 2.69%) | VIX is calm (17) | Employment stable (0.07)