May 14, 2026
Six weeks ago BTC traded $66,246 — 25.8% below its 200-day price trend. Today: $81,357, just 0.8% below. The engine flagged FAVORABLE then; the discount...

Six weeks ago BTC traded $66,246 — 25.8% below its 200-day price trend. Today: $81,357, just 0.8% below. The engine flagged FAVORABLE then; the discount...
The committee of twelve that replaced the gold standard, how it sets interest rates, and why traders watch its calendar so closely.
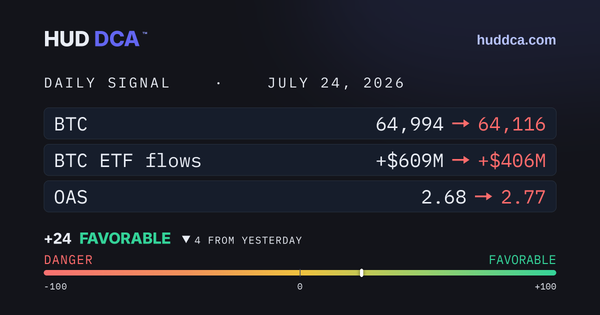
All ten risk thresholds read healthy today (see the 10-institional dashboard below) — credit, the Sahm rule, oil, the dollar, both ISM readings, volatility, BTC ETF flows and dominance, and stablecoins.
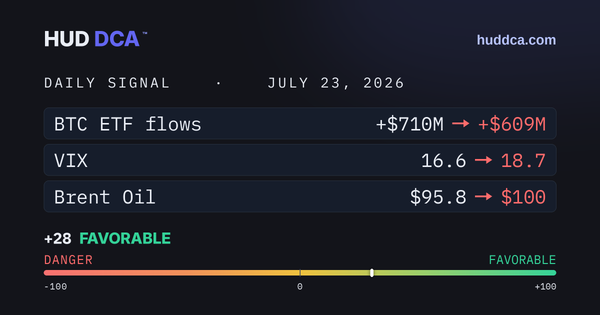
Brent oil: ~$71 (Jul 1) → $101 today, about +41% in three weeks.
Corporate Credit is healthy (OAS 2.69%) | VIX is calm (17) | Employment stable (0.07)