May 18, 2026

Two of the engine's strongest accumulation signals fired at once today: Crypto Fear & Greed dropped 15 points in three days, BTC MVRV at its cheapest in two weeks.
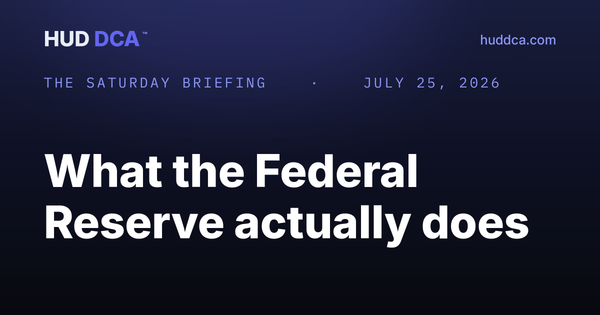
HUD DCA
Daily Market Intelligence
Forwarded to you? Subscribe →
Today’s Signal · May 18
+21
→ unchanged from yesterday
Continue DCA
FAVORABLE
−100 +100
Conditions favor accumulation
Conditions are modestly favorable. Standard DCA.
Today's Analysis
Positive
Sentiment cools and valuation cheapens — the patient-buyer setup
  1. Two of the engine’s strongest accumulation signals are now lit: Crypto Fear & Greed has dropped from 43 to 28 in three days (deep fear), and MVRV — Bitcoin’s on-chain valuation ratio that compares price to what holders paid — slipped to 0.82, its cheapest read in two weeks. Historically that combination favors patient accumulation.
Risks
Bitcoin gave back its 200-day rally
  1. Bitcoin is back below $77K, sitting 5.6% below its 200-day trend line. Just four days ago that gap had nearly closed (-0.8%). The April discount the engine flagged near $66K is re-opening — last week’s hot inflation data and the market repricing to zero Federal Reserve rate cuts in 2026 are the headwinds keeping it open.
Upcoming
PCE inflation in 10 days — the Fed’s official gauge
  1. May 28: April’s PCE inflation prints. PCE (Personal Consumption Expenditures) is the Federal Reserve’s official inflation target — the gauge that actually moves rate-cut odds. After last week’s hot consumer-price and producer-price reports, a hot PCE would cement the “no rate cuts in 2026” pricing markets just adopted. A cool print would be the first crack in that view.
Next: PCE (Apr) + GDP Q1 Second 10d
Bitcoin
Price · trend · valuation · flows
Bitcoin · Now
$76,975
-1.8% 24h
7D
Dominance vs Altcoins
Bitcoin holds the majority of crypto market cap
60.1%
Show advanced Bitcoin metrics ↓ 200D · ETF · Cycle · On-Chain
BTC vs 200-Day Avg -5.5%
BTC Price
$76,975
200-Day Avg Price
$81,433
200-day Simple Moving Average — Bitcoin’s average price over the last 200 days. Acts as a long-term trend line. BTC trading below the SMA = in a downtrend. A significant stretch above = parabolic move, historically a cycle-top warning.
Bitcoin · Demand
ETF Flows · 5d netCoinGlass
$-995MOutflows
May 11May 15
Mixed signals across the run
Bitcoin · Cycle Position
AccumEarlyLateDistBear
Early Bull · MVRV-Z 0.82
Bitcoin is undervalued relative to what holders collectively paid, and most holders are sitting on modest profit but not euphoria. Historically, these conditions favor steady DCA.
On-Chain Valuation
MVRV-Z
Undervalued
0.82
Compares Bitcoin’s market price to what holders collectively paid. Below 0 = historically cheap; higher readings = relatively expensive. Pre-2024 cycles topped near MVRV-Z 7–8; the 2025 cycle top reached only ~2.5, suggesting the ETF era may have compressed peaks.
NUPL
In profit
0.31
Net Unrealized Profit / Loss — how much profit holders are sitting on. Below 0 = underwater; higher readings = euphoric greed. Pre-2024 cycles peaked near 0.75; the 2025 cycle reached only ~0.56, suggesting the ETF era may have compressed peaks.
Ethereum & Altcoins
Price · altseason rotation indicator
Ethereum
$2,126
-3.0%
24h
ETH / BTC
0.0276
Bitcoin-led market
Altcoin Rotation
Bitcoin-led market — altcoins have not yet rotated
Markets
Stocks · cross-asset sentiment
S&P 500
7,403
-0.1%
Nasdaq
26,091
-0.5%
Dow
49,686
+0.3%
VIX Stock Market Fear
18
Calm
F&G Crypto Fear & Greed
28
Fear
Risk Dashboard
6 of 10 thresholds healthy · 1 showing stress
Show all 9 indicators ↓ OAS · Sahm · Brent · VIX · ISM · DXY · BTC
OAS
Corporate Credit
2.80%
Healthy
now 2.80%trigger 4.50%
Sahm Rule
trigger 0.50
0.13
Brent Oil
approaching trigger $110
$109
VIX
Volatility · trigger 35
18
ISM Manufacturing
Expanding · trigger 48
52.7
ISM Services
Expanding · trigger 49
53.6
DXY
US Dollar · approaching trigger 106
99.0
BTC Dominance
approaching trigger 63%
60.1%
BTC ETF Flows
Net 5-day · negative
$-995M
Stablecoin Mcap
30-day · growing
$318.6B
6 healthy · 3 elevated · 1 triggered
Dual Fear - Alert INACTIVE
VIX18
F&G28
Show how this indicator works ↓
When stock market fear and crypto fear spike at the same time, this lights up green — consider increasing your DCA. It's rare, and historically one of the best times to invest.
Score Breakdown
The daily score combines 13 indicators on a −100 to +100 scale, with 6 safety overrides monitoring for extremes. Think of it like a baseball batting average — a +30 is meaningful, the same way that a .300 batting average is great. A +60 is .400 territory — those are the rare readings. Most scores land between −30 and +30.
Show indicator-by-indicator scoring ↓
ECONOMY
+5Credit strong (OAS 2.80%)BULLISH
+5M2 growing (+2.6%)BULLISH
+3Weak dollar (DXY 99.0)BULLISH
+2Employment stable (0.13)BULLISH
+1Manufacturing positive (52.7%)BULLISH
MARKET SENTIMENT
-8BTC ETF outflows ($-995M)BEARISH
+7High fear (Fear & Greed 28)BULLISH
CRYPTO
+5MVRV undervalued (0.82)BULLISH
+1Stablecoin growing (+0.7%)BULLISH
— 4 indicators neutral (VIX calm, Services steady, BTC near 200-day avg, Dual Fear inactive)
+29 bullish + -8 bearish = +21
How the engine works, override triggers, and score thresholds:
Override Triggers
0 of 6
Show all override checks ↓
Credit crisis
Clear
Oil shock
Clear
Euphoria composite
Clear
VIX pause zone
Clear
VIX capitulation
Clear
Dual capitulation
Clear
All clear — score-based signal active
HUD DCA Score History
47d
Show score chart and trend detail ↓
Favorable zone · 47 days recorded unchanged
+47 +21
Mar 30Today
Chart color: green = trending up, blue = pulling back (still positive), red = trending into negative territory.
Bottom Line
Conditions are modestly favorable. Standard DCA.
New here? Visit the Briefing Room →
How the engine works, glossary, backtests, and more.
This is NOT financial advice. HUD DCA™ provides market condition assessments for informational and educational purposes only. HUD DCA™ LLC is not a registered investment adviser, broker-dealer, or commodity trading advisor. All historical results are hypothetical, backtested with the benefit of hindsight, and do not represent actual trading. Model parameters were optimized using historical data. Out-of-sample validation (2017–2019) was performed on data not used during calibration. Digital assets are highly volatile and involve substantial risk of total loss. Past performance is not indicative of future results. Consult a qualified financial advisor before making investment decisions.
Questions? hello@huddca.com