May 19, 2026
Today's score drop wasn't crypto. Bitcoin barely moved. Oil crossed $110 — the first yellow flag on the engine's risk dashboard in two months. Score slid five points on a single macro signal. BTC ETF outflows widened to -$1.7B.

Today's score drop wasn't crypto. Bitcoin barely moved. Oil crossed $110 — the first yellow flag on the engine's risk dashboard in two months. Score slid five points on a single macro signal. BTC ETF outflows widened to -$1.7B.

The committee of twelve that replaced the gold standard, how it sets interest rates, and why traders watch its calendar so closely.
All ten risk thresholds read healthy today (see the 10-institional dashboard below) — credit, the Sahm rule, oil, the dollar, both ISM readings, volatility, BTC ETF flows and dominance, and stablecoins.
Brent oil: ~$71 (Jul 1) → $101 today, about +41% in three weeks.
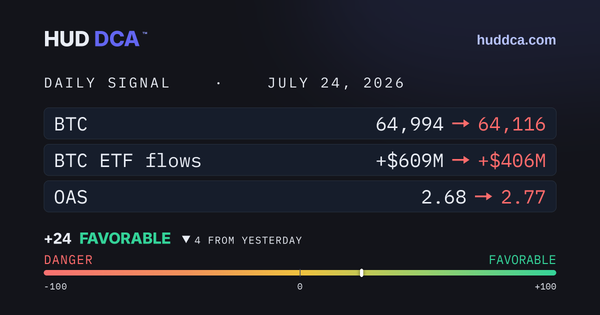
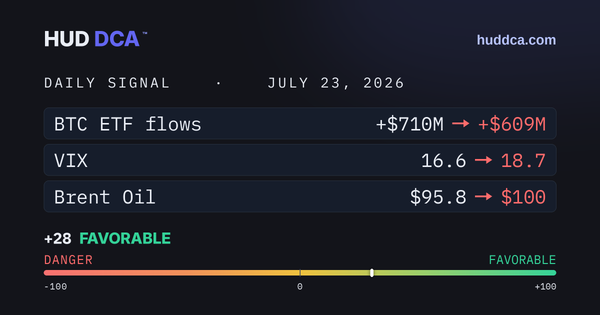
Corporate Credit is healthy (OAS 2.69%) | VIX is calm (17) | Employment stable (0.07)