May 27, 2026
PCE inflation prints tomorrow — the Fed's official gauge and the print that actually moves rate-cut odds. Engine paused at WAIT FOR ahead of the number. A hot reading...

PCE inflation prints tomorrow — the Fed's official gauge and the print that actually moves rate-cut odds. Engine paused at WAIT FOR ahead of the number. A hot reading...
The committee of twelve that replaced the gold standard, how it sets interest rates, and why traders watch its calendar so closely.
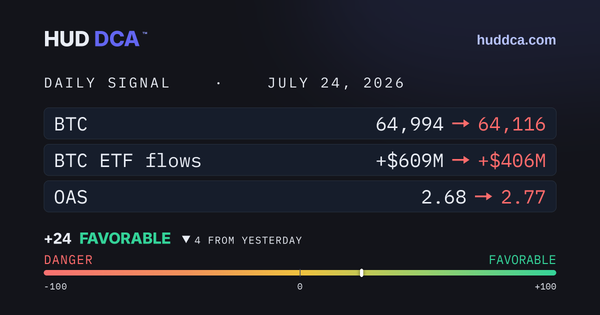
All ten risk thresholds read healthy today (see the 10-institional dashboard below) — credit, the Sahm rule, oil, the dollar, both ISM readings, volatility, BTC ETF flows and dominance, and stablecoins.
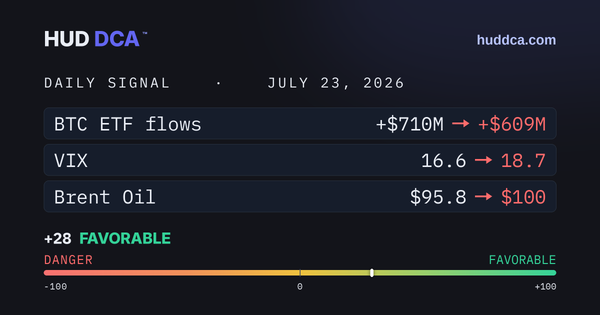
Brent oil: ~$71 (Jul 1) → $101 today, about +41% in three weeks.
Corporate Credit is healthy (OAS 2.69%) | VIX is calm (17) | Employment stable (0.07)