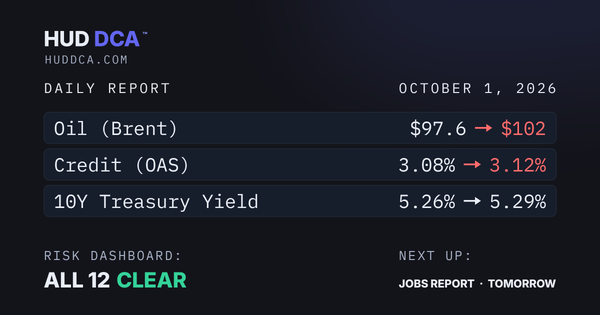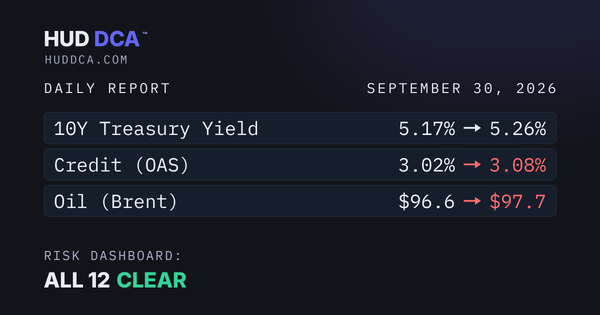
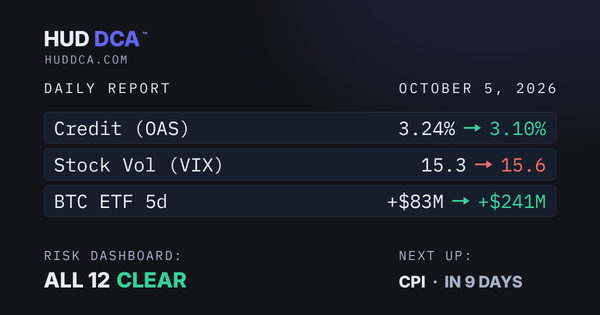
Sept 24: Oil climbs to $107

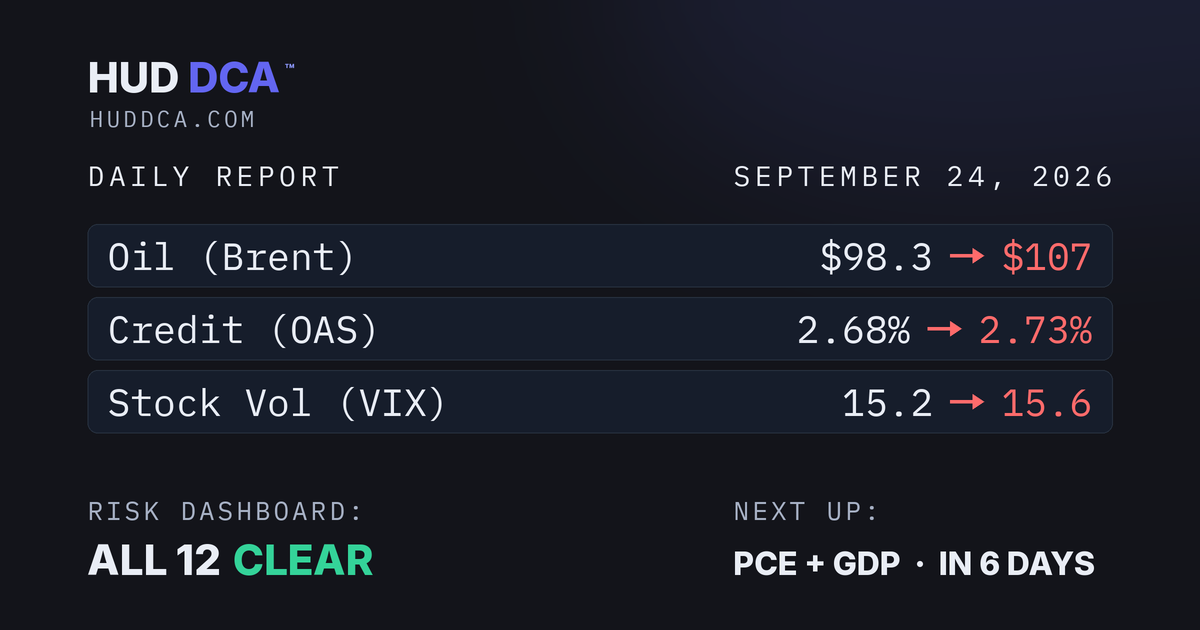
Oil climbed to $107 today, closing in on its $110 caution line. Corporate Credit is healthy and BTC ETF inflows hit $2.7B.

Sept 24: Oil climbs to $107
Next catalyst
PCE + GDP Q2 Final + FY End
In 6 days8:30 AM ET
What is this?

PCE: the Personal Consumption Expenditures price index, from the Bureau of Economic Analysis.

What it is: Another measure of inflation, built from what households actually spend their money on.

Why it matters: It is the inflation measure the Federal Reserve officially targets. The Fed’s goal is 2% a year.

How to read it: Readings well above 2% mean inflation is still above the Fed’s goal, which makes rate cuts less likely.

GDP: Gross Domestic Product, from the Bureau of Economic Analysis.

What it is: The total value of everything the U.S. produced over three months: the broadest scorecard of the economy. Each quarter is published three times as more data comes in (advance, second and final).

Why it matters: It answers the biggest question: is the economy growing or shrinking?

How to read it: It is shown as a yearly growth rate. Around 2% is a typical pace for the U.S.; below zero means the economy shrank that quarter.

Fiscal year end: the end of the U.S. government’s budget year, on September 30.

What it is: The federal budget year closes on the same day the quarter ends, when many large funds rebalance their holdings.

Why it matters: Rebalancing can cause bigger-than-usual money flows in stocks and Bitcoin ETFs for a day or two. If Congress has not approved new spending by then, a government shutdown can start, which can delay official data releases.

How to read it: Unusual moves around quarter-end can be mechanical rather than a real change in the outlook.

Also in the next two weeks
ISM Manufacturing PMI10:00 AM ETOct 1

ISM Manufacturing PMI: a monthly survey from the Institute for Supply Management. PMI stands for Purchasing Managers’ Index.

What it is: Every month, the people who buy supplies for hundreds of U.S. factories say whether their orders, production, hiring and prices went up or down. The answers roll up into one number.

Why it matters: Factories feel changes in demand early, so this is one of the first signs each month of whether the economy is speeding up or slowing down.

How to read it: Above 50 means factories are growing; below 50 means they are shrinking. The further from 50, the stronger the move.

Jobs Report8:30 AM ETOct 2

Jobs report: the official monthly jobs count from the Bureau of Labor Statistics, often called payrolls or NFP (nonfarm payrolls).

What it is: How many jobs U.S. employers added or cut last month, plus the unemployment rate: the share of people who want a job but do not have one.

Why it matters: Jobs drive paychecks and spending. The Federal Reserve watches this closely when it sets interest rates, and the unemployment rate feeds the Jobs (Sahm) row on the risk dashboard.

How to read it: Compare it with the forecast. Far fewer jobs than expected, or a rising unemployment rate, can be an early sign of a slowdown.

ISM Services PMI10:00 AM ETOct 5

ISM Services PMI: the same Institute for Supply Management survey, for service businesses.

What it is: Buyers at service companies such as stores, restaurants, banks, hospitals and shippers report whether business went up or down last month.

Why it matters: Services make up most of the U.S. economy. The survey’s prices section also shows whether businesses are paying more, an early clue about inflation.

How to read it: Above 50 means the service sector is growing; below 50 means it is shrinking.

Risk dashboard

✓ 12 clear▲ 0 caution● 0 alert

All 12 indicators are clear of their alert lines. Oil rose from $98.3 to $107, moving toward its alert line. Credit spreads rose from 2.68% to 2.73%, moving toward their alert line (alert above 4.50%). Closest to its alert line: Oil (Brent) at $107 (caution above $110 · alert above $135).
Green moved away from its alert lineRed moved toward itAmber this row is in cautionWhite no alert line to measure against
Moved today
Oil (Brent)$98.3→$107
Credit (OAS)2.68%→2.73%
Stock Vol (VIX)15.2→15.6
BTC ETF 5d+$2.0B→+$2.7B
Bitcoin MVRV0.75→0.77
✓Recession windowCleared2Y 4.71% · 10Y 4.96%25 mo clear
✓Oil (Brent)$107caution > $110 · alert > $135
✓BTC Dominance58.9%alert > 63%
✓US Dollar (DXY)101.29caution > 106
✓ISM Mfg PMI54.6alert < 48
✓ISM Svc PMI55.4alert < 49
✓Stock Vol (VIX)15.6alert > 35
✓Credit (OAS)2.73%alert > 4.50%
✓Jobs (Sahm)-0.07alert > 0.50
✓BTC ETF 5d+$2.7Balert < -$500M
✓BTC 200d Trend+19.2%alert < -15%
✓Stablecoins$282.0B30d +1.0% · alert -5%

Stocks

S&P 500
7,707
0.0%
Nasdaq
26,933
0.0%
Dow
51,380
▼ 0.3%
Oil $107 ✓ NormalVIX 15.6 ✓ Calm
Corporate credit (OAS)2.73%
0%alert 4.50%8%
✓ Healthy: the extra interest risky companies pay to borrow money. Low means lenders are confident. This is near the low end of its history. That is comfortable now, but calm credit has often come before weaker years.

Crypto

Bitcoin
$84,420
0.0% today
200-day average
$70,851
▲ 19.2% above
ETH $2,692 ▲ 0.6%Crypto F&G 71 ▲ Greed
Bitcoin dominance58.9%
405055586370%
← Altcoins leadingrisk appetite highFlight to Bitcoin →risk-off, altcoins weak
✓ Bitcoin-led: Bitcoin outpacing altcoins.

BTC ETF institutional flows

Five-day netCoinGlass · live
Sep 17Sep 23
+$2.7BInflows
5d+$2.7B
10d+$1.8B
30d+$5.2B
Institutions net buyers across all three windows.
Bitcoin valuation & cycleOn-chain
MVRV Z-Score
Low means holders are near break-even on average
0.77
NUPL
Share of supply in profit, on a 0 to 1 scale
0.31
Moderate profit
Price vs 200-day+19.2%
Cycle positionCool
Daily Report GuideReference ⌄
Just the terms on this page. Fuller explanations live in the Briefing Room.
Start here
DCA: dollar-cost averaging: buying a fixed dollar amount on a regular schedule, whatever the price. It is a discipline and a way to smooth out volatility, not the highest-returning strategy on paper.
Treasury note: a loan to the U.S. government for a set term. The 2-year and 10-year are the two watched here; longer-dated issues are called bonds. Prices and yields move in opposite directions.
Spread: the extra interest a riskier borrower pays above the U.S. government.
On-chain: data taken from the Bitcoin blockchain rather than an exchange.
Altcoin: any cryptocurrency other than Bitcoin.
Economy
Recession window (2Y vs 10Y): normally the 10-year note pays more than the 2-year. When it does not, the curve is inverted. The recession usually does not start while the curve is inverted; it tends to start after the curve returns to normal. The lag is long and variable, so treat this as a warning, not a countdown.
Corporate credit (OAS): the extra interest riskier companies pay to borrow. Low means lenders are relaxed; rising means they want more for the same risk. One catch: a very low spread is comfortable now but has often come before weaker years, because calm credit markets tend to get complacent right before they turn.
Jobs (Sahm rule): watches the speed of unemployment rather than the level.
ISM PMI: a monthly survey of the executives who place their companies’ orders. Above 50 means that sector is growing. The alert lines here, 48 for manufacturing and 49 for services, sit just under 50 as an early warning. ISM publishes its own, slightly lower, level for the wider economy, so these lines fire a little earlier on purpose.
US M2: the total pool of US dollars, not global M2.
U.S. dollar (DXY): the dollar against a basket of major currencies, though it is over half euro, so it is really a dollar-versus-Europe read. A strong dollar is a headwind for risk assets.
Oil (Brent): the global crude benchmark. Expensive oil is inflationary.
Stock volatility (VIX): the market’s fear gauge, priced from S&P 500 options over the coming month. Calm below 19.5; caution at 29.25 and the alert line at 35.
Crypto
Crypto Fear & Greed: a 0 to 100 sentiment index, read as a contrarian gauge. Under 25 is high fear, over 75 is greed.
BTC ETF flows: net money into or out of the U.S. spot Bitcoin ETFs. They hold Bitcoin directly, so inflows genuinely buy coins.
200-day trend: Bitcoin against its 200-day moving average, the most watched long-term trend line. Below it is a downtrend.
Bitcoin dominance: Bitcoin’s share of total crypto market value. Rising means money is crowding into Bitcoin and away from altcoins.
MVRV Z-Score: what Bitcoin trades at today against what holders collectively paid on-chain. Low means the average holder is near break-even; high means holders sit on large paper gains.
NUPL: how much of the supply sits in profit. Shown for context; it is mathematically close to MVRV.
Stablecoins: dollar-pegged crypto: cash parked inside the crypto system. Measured as a fixed basket of the seven largest, so the number moves only when their supply does, not when a tracker changes its list. It is a consistent gauge rather than the whole stablecoin market.
Cycle position: a temperature read from MVRV Z-Score: Cool under 1.0, Warming 1.0 to 2.5, Overheated 2.5 and above. Conditions, not a forecast.
Risk dashboard
Alert line: the threshold each row is measured against. The bar shows how much room is left, and rows are ranked with the closest to trouble at the top. Crossing one does not mean sell; it means a watched condition changed.
Go deeper in the Briefing Room →
Opens the website, away from this report: what each indicator measures and why it is on the dashboard. Definitions for the terms used in today’s report are in the Daily Report Guide above.
This is NOT financial advice. HUD DCA™ provides market-condition assessments for educational purposes only and is not a registered investment adviser, broker-dealer, or commodity trading advisor. Digital assets carry substantial risk of total loss, and past performance does not guarantee future results. Consult a financial advisor before investing.
Questions? hello@huddca.com
© 2026 HUD DCA™ LLC · Not financial advice