Sept 30: Inflation Cools, Growth Surprises
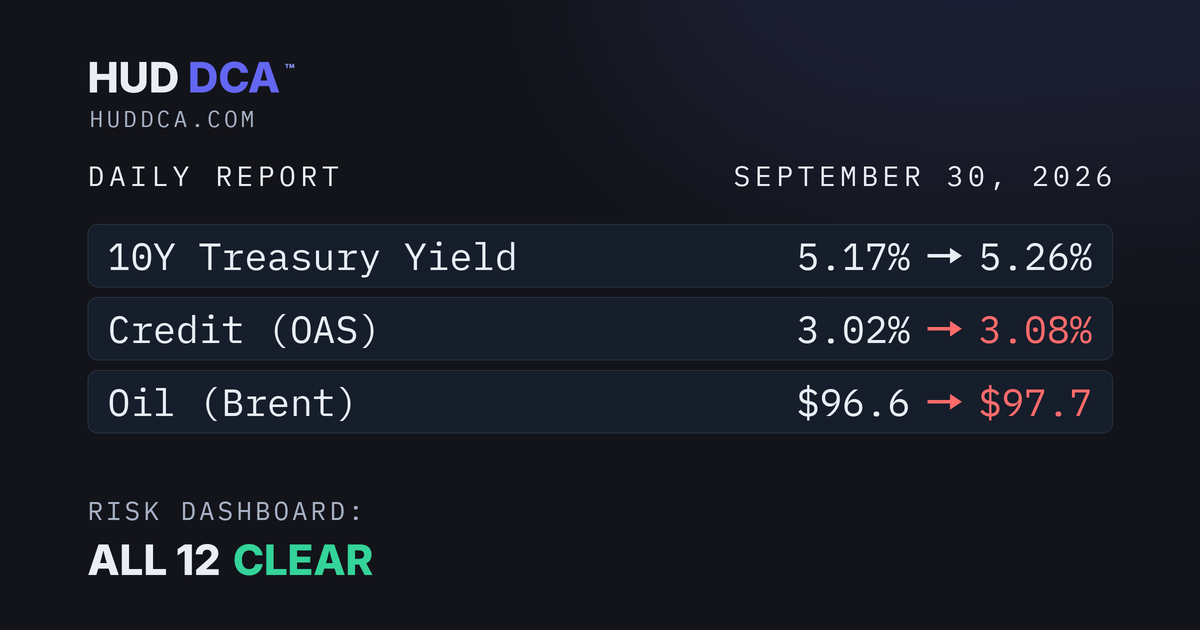
Inflation cooled more than expected in today's PCE report (3.4% headline, 3.0% core) and Q2 GDP was revised up to 2.2%. All 12 warning signs remain clear.

Risk dashboard
How to read this
We watch 12 warning signs across the economy, markets and digital assets. Each one has an alert line where trouble has often followed.
Each card shows today’s reading on the left and the line to watch on the right.
Green is clear. The bar turns amber at a caution line or red at an alert line. The white tick is today’s reading.
The two ISM surveys update monthly and appear in the full list below.
Today’s PCE inflation report came in cooler than expected (3.4% headline, 3.0% core), and Q2 GDP was revised up to 2.2%. Credit spreads (OAS) rose from 3.02% to 3.08%, moving toward their alert line (alert above 4.50%). Oil rose from $96.6 to $98.2, moving toward its alert line.
See all 12 warning signsall 12 clear ⌄
Recession watch: yield curve (10Y minus 2Y)
Yield curve: 10Y minus 2Y
As of Sept 29 close, U.S. Treasury yields
2Y yield2Y
4.89%
↓ from 4.92
10Y yield10Y
5.26%
↑ from 5.24
Spread
+0.37pts
↑ from +0.32
What to watch: every U.S. recession since the 1970s came after this spread went negative. The twist: the recession itself usually starts a few months after the spread turns back positive again. Fed's chart of past recessions ↗NY Fed: why inversions predict recessions ↗
More info on yield, spread and recessions
A yield is the interest rate the U.S. government pays to borrow for that length of time. The spread is the 10-year yield minus the 2-year, measured in percentage points: at +0.37, the 10-year pays 0.37 points more than the 2-year. Positive is normal; between 0 and +0.50 the curve is flat and close to flipping; below zero is called inverted.
The curve was inverted from mid-2022 to Sept 2024, the longest stretch on record, and has been positive for 25 months, but it has flattened from +0.74 in February. No recession has followed so far, which would make this cycle the first exception to the pattern.
Why it matters: the 2-year tracks where the Fed sets rates. The 10-year is set by investors, who buy long-term bonds when they expect the economy to slow and rates to fall later. When the 10-year drops below the 2-year, the bond market is saying it expects the Fed to be cutting rates soon, and the Fed cuts when the economy is in trouble.
Coming up
What is this?
ISM Manufacturing PMI: a monthly survey from the Institute for Supply Management. PMI stands for Purchasing Managers’ Index.
Buyers at hundreds of U.S. factories report whether orders, production and hiring went up or down last month. Above 50 means factories are expanding, below 50 means they are contracting. Factories feel demand shifts early, so this is one of the first signs each month of demand speeding up or slowing. One caveat: the whole economy usually keeps growing until the PMI drops into the low 40s, so a reading in the high 40s is a factory slowdown, not a recession call.