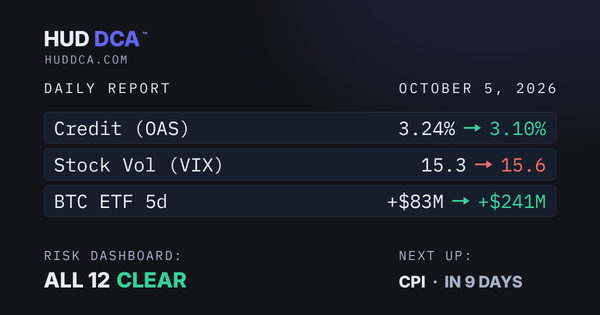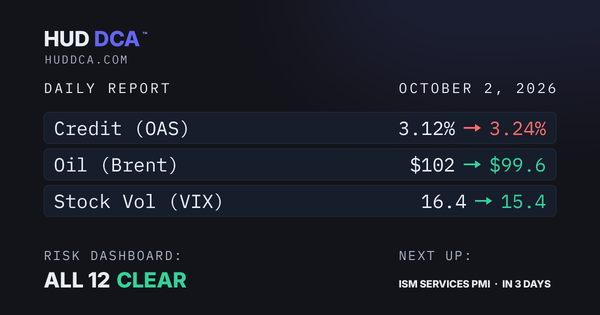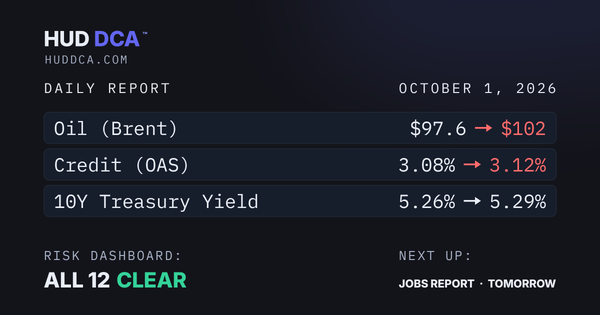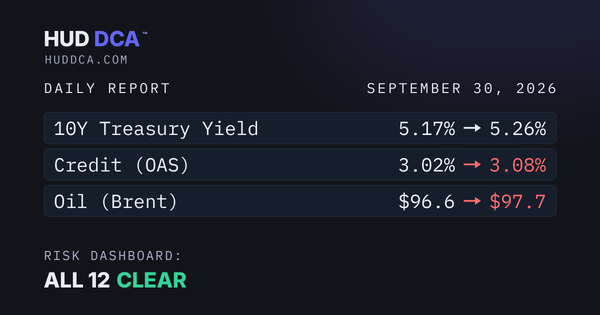
The Saturday Briefing: Corporate Credit Spreads (OAS)

What moved since the last issue
| Bitcoin | $83,909 |
| From $76,090, a gain of 10.3% since the last issue. Bitcoin sits 18.3% above its 200-day average, further above than the 10.3% at the last issue. Further above that average is marked green here. | |
| Stock Volatility (VIX) | 14.87 |
| From 15.13, down 1.7%, still inside the calm band. The number measures expected movement over the coming month, and less expected movement sits further from the alert line, so a falling reading is marked green here. | |
| Oil (Brent) | $104.32 |
| From $94.39, up 10.5% since the last issue. It is now the closest row to its line on the dashboard, with the caution line at $110. Moving toward that line is marked red here. | |
| BTC ETF flows (5-day) | +$2.39B |
| Net flow into Bitcoin exchange traded funds over the trailing 5 days, up from +$1.92B at the last issue. The dashboard's outflow alert sits at -$500M, far below, so steady inflows are marked green here. | |
Coming up
| Wed Sep 30 | PCE (Aug) + GDP Q2 Final + FY End |
| Thu Oct 1 | ISM Manufacturing PMI (Sep) |
| Fri Oct 2 | Jobs report (September) |
Corporate Credit Spreads (OAS)
While Bitcoin climbed more than ten percent and oil ran toward $110, the price of corporate credit barely moved. The option-adjusted spread opened the period at 2.75% and closed it at 2.80%. That stillness is the story, and this chapter is about how to read it.
Every company that borrows pays interest. The question is how much more than the US government it has to pay for the same length of loan, and that gap is the spread this chapter is about. It is the dashboard's credit row, and it has its own ladder.
What the number actually measures
When a company issues a bond, investors demand a higher yield than a US Treasury of the same length. The difference, quoted in percentage points, is the credit spread. "Option-adjusted" means the figure is cleaned up for quirks buried in some bonds, such as the right to repay early, so the comparison stays apples to apples. A reading of 2.80% means corporate borrowers pay 2.80 points more than the government to borrow for the same term.
The dashboard tracks one version of this: the option-adjusted spread on the ICE BofA US High Yield index, a broad basket of corporate bonds, reported through FRED. Think of it as the price of trust in the credit market. When lenders get nervous they charge more and the spread widens. When they are confident it tightens.
The four rungs
One ladder, used everywhere the engine reports a reading. Below 4.00 is Healthy, and the engine's note reads "lenders confident". From 4.00 to 4.49 is Widening, "watch credit". From 4.50 to 5.99 is Stressed, and 4.50 is where the dashboard's alert line sits. At 6.00 or higher the dashboard reads a full credit crisis.
| Below 4.00% | Healthy |
| Lenders confident. September 25 closed here, at 2.80%. | |
| 4.00 to 4.49% | Widening |
| Watch credit. The spread is widening but not stressed. | |
| 4.50 to 5.99% | Stressed |
| The dashboard's alert line sits at 4.50. | |
| 6.00% or higher | Credit crisis |
| The dashboard's top rung. | |
The line that marks unusually calm credit
There is one more line on the chart, at 3.00, and the engine does something deliberate with it: nothing. It is display only. It never changes a reading and never triggers anything. Readings below it sit in roughly the bottom tenth of the index's history since 1996.
The engine's own note on the line cites Lopez-Salido, Stein and Zakrajsek, writing in the Quarterly Journal of Economics in 2017: spreads this tight have tended to arrive when lenders are at their most confident, and they have often arrived ahead of weaker years. Tight spreads read as calm today. The marker exists so that particular kind of calm stays visible.
Where spreads sit now
On September 25 the index closed at 2.80%, a touch above the 2.75% at the last issue. That is Healthy by the ladder, and it sits just under the 3.00 marker, inside the tight zone. The dashboard's alert line is at 4.50 or higher, a long way off.
Translation: lenders are charging almost nothing extra for corporate risk right now. That is good news, and it is also exactly the kind of calm the 3.00 marker exists to flag. Nothing on the credit row is asking for attention. The marker is there so you notice the calm itself.
Where this came from
The spread data in this chapter is the ICE BofA US High Yield Index Option-Adjusted Spread, published daily by the Federal Reserve Bank of St. Louis (FRED series BAMLH0A0HYM2.)
The research on credit-market calm and what tends to follow it: Lopez-Salido, Stein, and Zakrajsek, "Credit-Market Sentiment and the Business Cycle," Quarterly Journal of Economics (2017) (<free working-paper PDF).
| Risk dashboard | 12 clear, 0 caution, 0 alert |
| Oil (Brent) climbed from $94 to $104 since the last issue and is now the closest row to its line. The other eleven rows stayed clear. | |
| Closest to its line | Oil (Brent) $104 |
| Caution at $110, alert at $135. | |
| Next catalyst | PCE + GDP Q2 Final + FY End, Sep 30 |
| 8:30 AM ET. The Fed's preferred inflation gauge, with the final read on Q2 growth. | |
Next issue: Saturday, October 31. Chapter 12: What is M2 money supply, the total dollars in the economy, and why it matters for asset prices.
| See all daily reports → |
HUD DCA is educational. Nothing here is investment advice or a forecast. The dashboard describes market conditions, not what anyone should do.
HUD DCA · huddca.com